Property owners’ knowledge and attitudes towards property taxation in Tanzania
The analysis of property owners’ knowledge of and attitude towards PT is divided into four parts:
1. Tax knowledge and administrative constraints
2. Attitudes towards paying PT
3. Perceptions regarding fairness of the property tax
4. Property tax and local service delivery
How to cite this publication:
Merima Ali, Odd-Helge Fjeldstad and Lucas Katera (2018). Property owners’ knowledge and attitudes towards property taxation in Tanzania. Bergen: Chr. Michelsen Institute (CMI Insight 2018:01)
Property taxation (PT) is high on the political agenda in Tanzania and considered a cornerstone of the Government’s efforts to strengthen broad based direct taxation. Because it is visible to taxpayers, and in principle linked to improved local services, PT holds a unique potential to act as a foundation for bargaining between taxpayers and governments over revenue and public spending. Yet, property tax generates limited revenues. One barrier to effective taxation is the resistance it faces from property owners. Information on property owners’ knowledge about and attitudes towards the property tax system, including their acceptance of paying the tax, are required for better analysis and more informed tax policy design. In this Insight we presents findings from a survey of property owners in Dar es Salaam and Mtwara.
Property taxation in Tanzania
Property tax (PT) is levied as an annual charge payable by owners of urban residential and commercial buildings. Property tax generates limited revenues in Tanzania. In fiscal year 2015-16, revenues from PT accounted for only 0.16 per cent of GDP. In comparison, PT in some OECD countries account for more than 2 per cent of GDP. Weak administrative capacity, including incomplete and outdated property registers and valuation rolls, is considered one of the major constraints on PT collection in Tanzania. Another constraint is the resistance it faces from property-owners, who can block both policy reform and effective implementation. See CMI Working Paper 1-2018 for further details on the PT regime in Tanzania and changes in this over time.
Attempts to broaden the property tax base should build on insights into how citizens experience and perceive the tax administration and enforcement, and whether and how their tax behaviour is correlated with their perceptions.
The survey
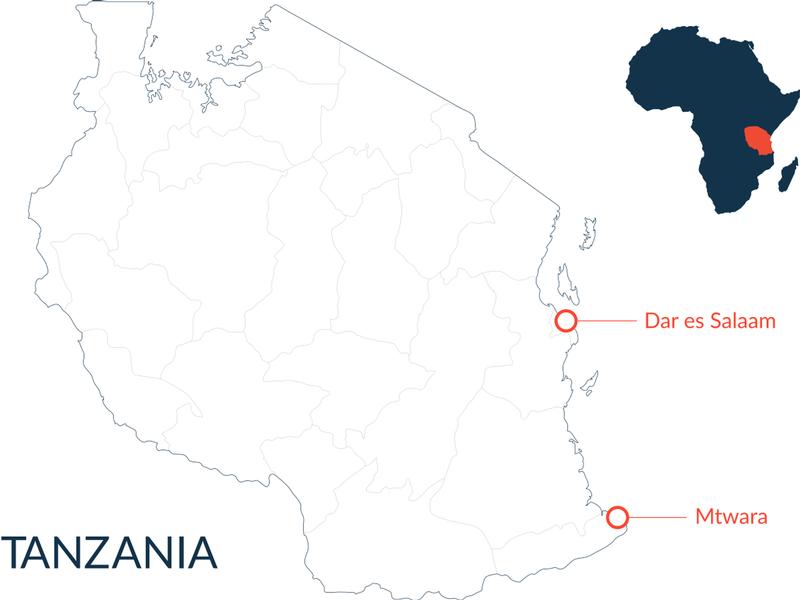
The survey was undertaken in Dar es Salaam and Mtwara (see the Map). Dar es Salaam was chosen because it is the largest and fastest growing urban centre in Tanzania. The data was collected from three municipalities in Dar es Salaam (Ilala, Kinondoni and Temeke). The much smaller Mtwara Urban Council in Southern Tanzania was chosen because it, until recently, was rapidly developing and attracting investments in connection with natural gas exploration and extraction. By focusing on Dar es Salaam and Mtwara, the study can examine the different features and challenges facing the development of a fair and effective property tax system in large, established municipalities as compared to new ‘boom-towns’.
The survey was conducted in October 2017 and covered 250 randomly selected property owners, of which 150 were selected from the three municipalities in Dar es Salaam (50 respondents in each), and 100 respondents in Mtwara. The average years of property ownership in the sample is around 30 years. Almost three quarters (73%) of the surveyed properties are residential, and the remaining commercial. The majority of properties (53%) are owner-occupied. Only 10% of the properties are exempted from paying property tax.

The analysis of property owners’ knowledge of and attitude towards PT is divided into four parts:
- Tax knowledge and administrative constraints, including the level of understanding about the purpose of the PT and how properties are valued.
- Attitudes toward paying PT.
- Fairness of the PT, including whether the tax rate, the property evaluation method and the overall enforcement mechanisms are perceived as fair, efficient and equal.
- Satisfaction with public service provision and what they get in return for paying PT.
1. Tax knowledge and administrative constraints
In general, property owners in the survey have a fairly good understanding of the purpose of PT. Almost half of the respondents (49%) stated that the purpose of PT is to improve local services. About one third (35%) stated that it is to generate revenue to the government.
|
Within the last five years |
46 |
|
Within the last ten years |
5 |
|
More than 10 years ago |
9 |
|
Never |
28 |
|
I don’t know |
12 |
As many as 46% of the respondents said that their property was valued during the last 5 years (Table 1), while 28% said their property had never been valued. However, we observe substantial differences between the municipalities (Figure 1). In Mtwara, 38% of the respondents stated that their property had never been valued, compared to 18% of the property owners in Temeke municipality. Temeke has by far the largest share of respondents who stated that they don’t know if their property has ever been valued. The difference in this regard between Temeke and the two other municipalities in Dar es Salaam (Ilala and Kinondoni) might be due to the fact that Temeke is the least developed one with respect to residential houses and municipal administrative capacity.

The majority (close to 64%) of those who said that their property had been valued, stated that the valuation of the property was based on either a quick or a detailed assessment of the building, or based on the market value related to location (Table 2). Only 17% stated that the valuation was based on a flat rate. The remaining (19%) said that they did not know how the valuation was made. Valuation based on a flat rate was highest in Mtwara (29%), followed by Temeke (23%).
|
|
Total |
Ilala |
Kinondoni |
Temeke |
Mtwara |
|
Through a quick examination of the building |
30 |
36 |
48 |
18 |
23 |
|
Through detailed examination and valuation |
31 |
31 |
30 |
40 |
27 |
|
Through an estimate based on location |
3 |
6 |
3 |
3 |
3 |
|
Based on a flat rate |
17 |
6 |
3 |
23 |
29 |
|
I don’t know |
19 |
22 |
18 |
18 |
18 |
Respondents who stated that their property had been valued were further asked about their view of the rateable value given to their properties (Figure 2). The majority stated that the value was too high (68%). Less than one third of the respondents (31%) stated that it was fair.
The majority (74%) stated that they paid the PT to the central government Tanzania Revenue Authority (TRA). The most common method of payment for property owners in Dar es Salaam is through bank transfers (Figure 3). In Mtwara, as many as 70% of the respondents relied on cash payment. Very few made payments through the electronic payment system MaxMalipo.
Property owners who said they had recently paid PT were asked about the different constraints they faced when paying PT (Table 3). The main constraints facing property owners when paying PT are (1) that it takes a lot of time to pay PT (38 %); (2) they do not know how the PT is calculated (26%); and (3) lack of information on how the Government uses the revenues collected (12%). The respondents in all the three municipalities in Dar es Salaam mention the time-consuming process of paying PT as the most important constraint. In Mtwara, the most important constraint is lack of information on how the PT is calculated. The reason why time seems to be an important issue for the respondents in Dar es Salaam, might be due to the shift of property tax administration from the municipalities to the national Tanzania Revenue Authority (TRA) in 2016.[1] One notable change introduced by the TRA was that no transactions of tax payment should take place in cash. Municipal officers interviewed in Dar es Salaam, complained about the cash free system of payment and reported the inconvenience and extra costs that this system was causing to taxpayers who had to travel to banks to pay the tax. In Mtwara, on the other side, the much smaller urban setting makes it easier for taxpayers to pay.
|
I don’t know how the property tax is calculated |
26 |
|
I don’t know who to consult when I have questions regarding PT |
4 |
|
It takes a lot of time to pay the PT |
38 |
|
It takes too long for tax officials to respond to questions on PT in general |
7 |
|
It takes too long before tax officials respond on complaints on the PT rate |
6 |
|
The government does not provide enough info. on how it uses the revenues collected |
12 |
|
Others |
7 |
2. Attitudes towards paying PT
In order to capture property owners’ compliance attitude, they were asked to state their opinion regarding not paying PT. More than half (52%) of the property owners respond that not paying PT is wrong and punishable (Figure 4). However, almost 45% respond that not paying PT is wrong but understandable or it is not wrong at all. Property owners were further asked about their opinion on how often people avoid paying PT.[2] Close to 50% of the respondents say that people avoid paying PT always and often (Figure 5). Reponses from both these questions highlight that there is in general a high level of non-compliance among property owners.
Property owners in Dar es Salaam have a higher level of non-compliance attitude compared to those in Mtwara (Figure 6). In Dar es Salaam, Kinondoni municipality has the highest share of respondents (58%) stating that people avoid paying PT always and often, compared to 43% of the respondents in Mtwara. This might be because Mtwara is a much smaller and more transparent location than the Dar es Salaam municipalities.
The most important reasons, according to property owners, why people avoid paying PT are mentioned in Table 4.[3] Close to 44% state that the main reason is that the PT system is unfair or because the tax rate is too high or unaffordable (reasons 1-3). Another main reason is the property owners’ dissatisfaction with local service provision and their belief that the government wastes the tax money (reasons 4-5). Close to 26% of the respondents have these views.
|
1 |
The PT system is unfair |
14 |
|
2 |
Property taxes are too high |
13 |
|
3 |
People cannot afford to pay PT |
18 |
|
4 |
People receive poor services from govt. |
13 |
|
5 |
The Government wastes tax money |
13 |
|
6 |
Government officials steal tax money |
4 |
|
7 |
People know they will not be caught |
4 |
|
8 |
None |
19 |
An unfair property tax system and high and unaffordable rates, as perceived by property owners, stand out as the main reasons for non-compliance in all locations (Figure 7). Ilala municipality, followed by Mtwara have the largest share of respondents stating unfairness and unaffordability as the main reasons. We discuss the perceived unfairness of the PT system and property owners’ views perception about service provision in detail in the coming sections.
3. Perceptions regarding fairness of the property tax
Close to 58% of the respondents think that the tax is very fair or somewhat fair (Figure 8). A considerable share (34%) respond that the tax is unfair. Those who stated that PT is unfair were further asked to list the most important reasons behind the unfairness of the PT (Table 5). The majority of property owners (20%) point out that the reason is because the tax is too high. In a related response, 12% stated that the tax they pay does not consider their ability to pay. Another 12% also responded that PT is unfair because different rates are applied to similar properties in the municipality. This may be due to, for example, variation in the way tax payment is enforced between property owners depending on their political connectedness. Failure of PT to take into account the income capacity of property owners (such as older people or those with unpredictable income sources) and variation in the enforcement among property owners may lead to distortionary income-redistribution.
|
The property tax is too high |
20 |
|
The property tax does not take into account one’s ability to pay in terms of income |
12 |
|
Different rates are applied to similar properties in the municipality |
12 |
|
Not getting local services in return from government |
7 |
|
Some property owners do not pay the tax |
5 |
|
Property tax is not acceptable by the public |
5 |
|
Already paying other related taxes such |
5 |
|
Other reasons |
4 |
|
None |
31 |

Figure 9 shows the variation in responses by location about the reasons why PT is seen as unfair. High tax rate is mentioned as the most important reason for the perceived unfairness in all locations except in Temeke where different rates applied to similar properties in the municipality is most important.
4. Property tax and local service delivery
Only 15% of the property owners perceive that the tax they pay contributes to local service provision by a large amount (Figure 10). The remaining 85% think the PT contributes either only a bit or not at all to improve local services. This highlights the level of dissatisfaction by property owners on how the government uses the tax money although the majority believe that the purpose of PT is to improving local services.

The majority of the respondents in all the three municipalities in Dar es Salaam believe that property tax does not lead to improved public services at all (Figure 11). In Mtwara, on the other hand, close to 66% of the respondents believe that property tax leads a bit to improved public services. Respondents were further asked if they would be willing to pay more PT in order to see local services improve. The majority (56%) stated that they would be willing to pay more tax to see local services improve. Figure 12 shows the services that property owners would like to see improved. Health services, education and roads are the three most important local services that property owners would be willing to pay more PT in order to see improved. These responses highlight that better local service provision could help improve compliance attitude among property owners.
Concluding remarks and implications for policy
Attempts to broaden the property tax base should build on insights into how citizens experience and perceive the tax administration and enforcement, and whether and how their tax behaviour is correlated with their perceptions. The study shows that there is generally high level of non-compliance among property owners. Tax administration will only earn taxpayer compliance by creating a climate of fairness and trust. This emphasises the importance of openness on how properties are valued and that similar rates are applied to similar properties in the municipality.
Perceptions of an unfair property tax system and high and unaffordable rates stand out as the main reasons for non-compliance. Dissatisfaction with local service provision is also an important reason. Many property owners resist paying their bills due to the lack of any visible benefits, especially in areas with poor infrastructure and irregular or non-existent service delivery. To enhance voluntary compliance, there is a need to establish clearer links between tax payment and improved services.
Attention should be given to educating taxpayers on the rationale, procedures, obligations and responsibilities related to property tax. However, in contrast to the municipal staff, TRA has limited knowledge about the local PT base. In addition, TRA is not well placed to connect PT compliance with improved local services. These observations suggest that creating constructive working relations between the central government and the municipalities might be a catalyst for more effective collection of property tax. For instance, TRA may use local structures like ward and mtaa (street) executive offices to inform property owners and facilitate tax payment, since these structures are the ones working on a day-to-day basis with local residents and businesses. Provision of easy payment options, such as the electronic payment system MaxMalipo and mobile phone-based systems like M-Pesa, should also be expanded.
Further research that empirically examines the determinants of the compliance attitude of PT is needed in order to understand how compliance attitude varies by type of property owned and the level of knowledge of taxpayers about the tax administration and their overall satisfaction with different levels of local services.
Recommended literature
Ali, M., Fjeldstad, O.H. and Katera, L. 2017. Property taxation in developing countries. CMI Brief 1: 2017 (March). Bergen: Chr. Michelsen Institute.
Bird, R.M., and Slack, E. 2007. Taxing land and property in emerging economies: raising revenue…and more? In G.K. Ingram and Y.H. Hong (eds). Land Policies and Their Outcomes. Lincoln Institute of Land Policy: Cambridge, MA.
Fjeldstad, O.H., Ali, M. and Katera, L. 2018. Policy implementation under stress: Central-local government relations in property tax collection in Tanzania. CMI Working Paper WP 1: 2018. Bergen: Chr. Michelsen Institute. Also published as ATI Working Paper 1: 2018. Pretoria: African Tax Institute, University of Pretoria.
Fjeldstad, O.H., Ali, M. and Goodfellow, T. 2017. Taxing the urban boom: property taxation in Africa. CMI Insight 1: 2017 (March). Bergen: Chr. Michelsen Institute.
Franzsen, R.C.D. and McCluskey, W.J. (eds.). 2017. Property Tax in Africa: Status, Challenges and Prospects. Cambridge MA: Lincoln Institute of Land Policy.
Kelly, R. 2013. Making the property tax work. International Center for Public Policy Working Paper 13-11. Atlanta: Andrew Young School of Policy Studies, Georgia State University. Available from: http://scholarworks.gsu.edu/cgi/viewcontent.cgi?article=1041&context=icepp.
McCluskey, W. and Franzsen, R. 2005. An evaluation of the property tax in Tanzania: an untapped fiscal resource or administrative headache? Property Management, Vol. 23, No. 1, pp. 45-69.
Notes
[1] See ATI Working Paper 1: 2018. “Policy implementation under stress: Central-local government relations in property tax collection in Tanzania.” Pretoria: African Tax Institute, University of Pretoria. Also published as CMI Working Paper WP 1: 2018. Bergen: Chr. Michelsen Institute.
[2] Given taxpayers reluctance to reveal one’s own non-compliance, this question is framed indirectly in order to avoid implication of “wrongdoing” by respondents.
[3] The table summarises responses by excluding those property owners who responded that "people don’t avoid paying taxes" or "I don’t know" when asked about their opinion regarding how often people avoid paying PT as shown in Figure 2.
Odd-Helge Fjeldstad


