Household wellbeing and coping strategies in Africa during COVID-19 – Findings from high frequency phone surveys
2.2. Methodology and limitations
3.1.2. Country-specific findings[7]
3.3. Coping strategies and social assistance
3.5.2. Country-specific findings
4.1. Potential areas of engagement for Norwegian development aid
4.3. Consider monitoring other important themes
4.4. Consider a special focus on people living in conflict and other marginalized populations
How to cite this publication:
Carlo Koos, Peter Hangoma, Ottar Mæstad (2020). Household wellbeing and coping strategies in Africa during COVID-19 – Findings from high frequency phone surveys. Bergen: Chr. Michelsen Institute (CMI Report 2020:4)
This report provides data on household wellbeing in countries in sub-Saharan Africa following the Covid-19 pandemic. The focus is on employment and income, food security, and coping mechanisms, and on access to education and health care.
1. Executive summary
This report documents key aspects of household wellbeing in selected countries in sub-Saharan Africa (SSA) during the COVID-19 crisis. Our findings are based on high-frequency phone surveys from the World Bank (Ethiopia, Malawi, Mali, Nigeria, Uganda) and the World Food Programme (Malawi, Mali, Mozambique, Nigeria, Niger, and DRC).
Many households lost employment, experienced reduced household income, faced high food insecurity, and had challenges in accessing markets and healthcare. Most children have been out of school for a period of six months, and few children have been engaged in learning activities during this period. On the other hand, we do not find evidence of increased food insecurity in the wake of COVID-19. Nor do we observe a general tendency to increased use of crisis level coping strategies in households. Access to health care also appears to have remained relatively high.
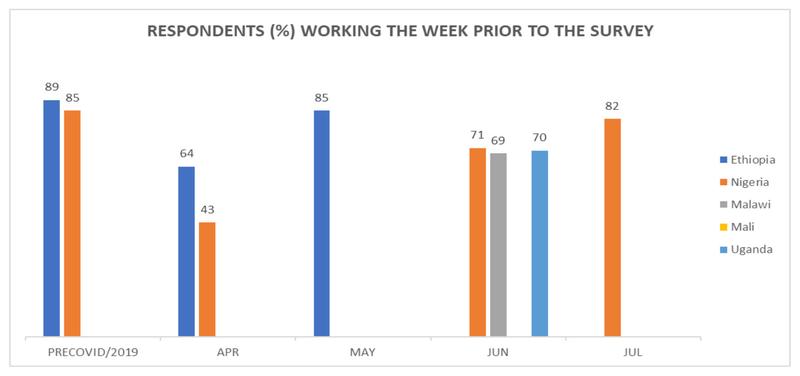
Employment levels dropped significantly after the lockdowns but recovered substantially in the following months. For instance, pre-COVID-19 employment levels in Ethiopia were at 89% and in Nigeria at 85%. After the lockdown measures, self-reported employment levels fell to 64% in Ethiopia and 43% in Nigeria. As early as May, Ethiopia’s employment levels were back at 85% and Nigeria’s employment increased to 71% in June and 82% in July. Malawi and Uganda reported similar employment levels as Nigeria.
Food insecurity was high throughout the period April-October 2020. Niger, Mali, and the DRC were among the worst off countries and more than half of the households reported insufficient food consumption. However, there is no evidence that food insecurity increased in the corona period. In fact, food insecurity reduced in Malawi. On average, urban households face higher food insecurity than rural households.
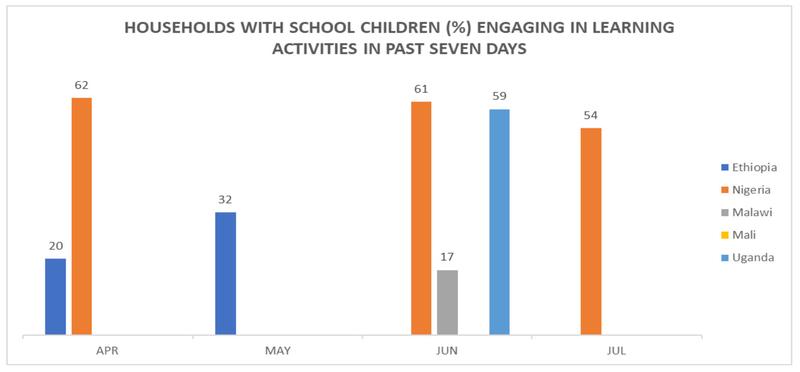
Children’s access to education has been severely affected by COVID-19 lockdowns. Virtually all countries in Africa closed their schools by the end of March 2020. Educational activities for school children—e.g. assignments from teachers, watching or listening to educational programs— have been limited during school closures. In the best-performing countries—Nigeria and Uganda—between 54% and 62% of households with school children reported that their children were engaged in different types of learning activities. In Ethiopia and Malawi, only between 17% and 32% reported educational activities.
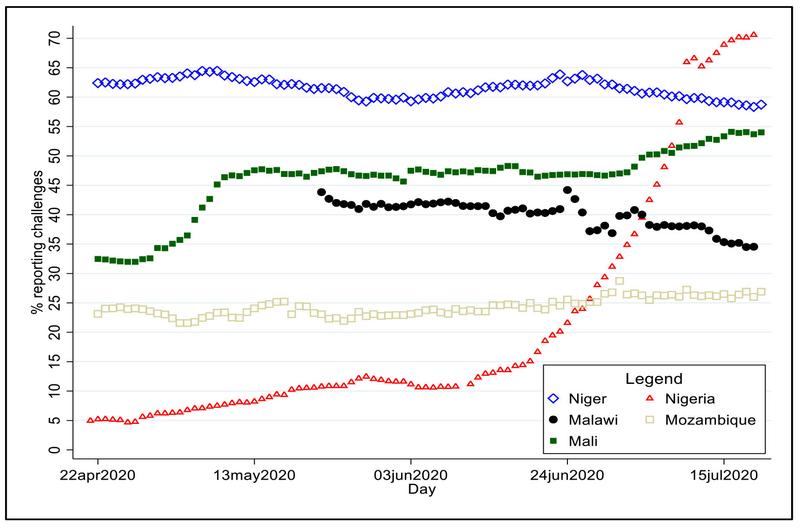
Most households (74-92%) were able to receive health care when they needed it. However, people still reported challenges in accessing health services regardless of whether they received it or not. Nigeria experienced a sharp increase in people reporting challenges related to accessing health services coinciding with the peak of COVID-19 cases in June-July. Access challenges were consistently high in Niger and Mali.
A large share of households—up to 35%—have employed crisis level coping strategies (e.g. reducing food consumption, selling assets), which could result in adverse long-term consequences. There is no general pattern of increased use of such strategies after the onset of COVID-19, but there is some variation across countries.
Based on our findings, we provide recommendations on potential areas of engagement for Norwegian development cooperation. We also recommend continuing monitoring socio-economic developments during the pandemic and considering expanding the monitoring to other critical domains, including a particular focus on vulnerable groups.
2. Introduction
2.1. Background
COVID-19-related lockdown measures have affected people’s income and livelihoods, including access to health care, markets, and education. In order to develop an appropriate policy response to this precarious situation, it is crucial to monitor the situation on the ground with timely and representative household data.
This report aims to provide policy makers with the most recent data on household wellbeing and coping strategies in Norwegian partner countries, as well as other countries of particular interest to Norwegian development policy in sub-Saharan Africa. Our focus is on employment and income, food security, and coping mechanisms, and on access to education and health care.
2.2. Methodology and limitations
The report is based on household data from (i) the World Bank’s LSMS-supported High-Frequency Phone Surveys on COVID-19[1] (henceforth WB data) and (ii) the World Food Programme’s phone surveys[2] (henceforth WFP data). Both WB and WFP data aim to provide near real-time data on household wellbeing and coping strategies. Both data sources aim to be representative at the national level (WB data also for rural and urban households) which makes these data particularly valuable for policy makers.
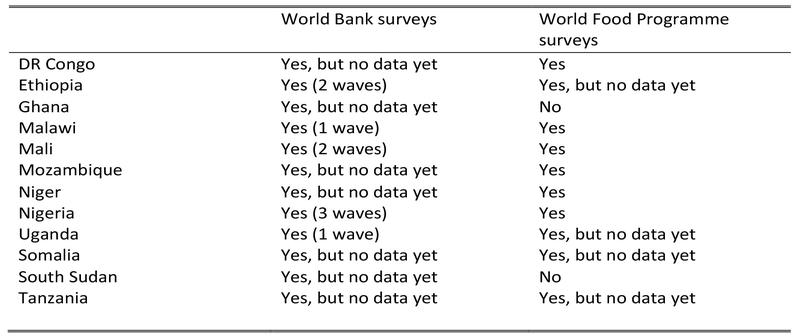
Table 1 below shows the country coverage of the two data sources in relation to a list of countries in SSA that are of particular interest in relation to Norwegian development cooperation. The World Bank surveys cover the full list of countries, while the WFP surveys cover all countries except Ghana and South Sudan. However, data is not yet available for all countries. The report is based on data available as of 1 September 2020, including nine waves of WB data from five countries. Additional waves of data on these and other countries are expected in the coming months. The WFP data included in this report consists of daily welfare and access indicators that are representative at the country level for the period 15 April to 24 July. Data on food insecurity and coping strategies cover the period up to 1 October.
Table 1: Countries covered by WB and WFP surveys
The WB and WFP data differ in how they construct their samples. The WB surveys draw on recent Living Standards Measurement Survey (LSMS) samples that, in most cases, were used for surveys in 2018 or 2019. The WB aims to re-contact all respondents from these previous surveys, but reports have shown that a significant share (5-30%) could not be contacted by phone. The sample sizes of the WB data vary from around 1,000 to 1,600 respondents.
The WFP does not draw on any preexisting sample frame but uses techniques such as random digital dialing or customer data bases from mobile phone service providers to build its sample. The WFP surveys report daily data, which allows assessing trends in real time. They interview around 32 randomly selected persons per day per country and use a rolling sample where each household is re-interviewed a few times (with a gap of 1 to 3 months between interviews) before being replaced with another household.
While both WB and WFP provide unique data during COVID-19, both come with important limitations. Phone surveys are a particularly challenging way of collecting high-quality data. First, logistical and technical challenges including poor network coverage and related audio quality may impair the quality of the interview. Second, the lack of personal face-to-face contact can make it difficult to establish sufficient trust between the enumerator and the respondent. This distrust may bias responses to potentially sensitive questions, especially in autocratic regimes. Third, many key questions in the WB questionnaires differ slightly across countries, which makes cross-country comparisons more difficult. This is one of the reasons why we cannot report data for some countries in the comparative charts in this report, although surveys have been implemented. Fourth, while COVID-19 has plausibly affected many of the indicators we discuss, changes that occur from before, during and after COVID-19 are not necessarily only the result of COVID-19. Other factors could also be at play. Fifth and finally, there may be issues of representativeness as rural areas may not have the same phone penetration as urban areas.
3. Findings
The findings are summarized along the following themes: employment and household income, food security, coping strategies and social assistance, education, and health care. For each theme, we first provide one or more comparative charts for key indicators across countries and over time, and briefly discuss common trends or divergences. Second, we summarize the key developments within those countries for which we have more detailed information than provided in the comparative part. This country-level discussion provides more information on potential differences between urban and rural areas and, if available, across income groups.
3.1. Employment and income
3.1.1. Comparative findings
Employment: Employment levels dropped sharply after COVID-19-related lockdowns were implemented but recovered swiftly in the following months. These trends are clearly displayed in the cases of Ethiopia and Nigeria. Figure 1 shows the share of respondents that reported working in the week prior to the interview.[3] We make the following observations: First, employment rates in April dropped significantly below pre-COVID-19 levels in both Ethiopia (from 89% to 64%) and Nigeria (from 85% to 43%). Second, employment levels were almost back to pre-COVID-19 levels in May in Ethiopia (85%) and in July in Nigeria (82%). This is a quick recovery. Third, while we do not have longitudinal data for Uganda and Malawi, the chart shows similar employment rates as Nigeria in June (between 69 and 71%), and we can at least speculate about a similar recovery pattern in employment.
Note that the data do not tell anything about how much people worked. This should be improved in future surveys by asking people about how many hours they worked.
Figure 1: Employment
Source: LSMS-Supported High-Frequency Phone Surveys on COVID-19[4]
Note: Pre-COVID-19 data for Nigeria are based on Living Standards Measurement Survey 2019 and for Ethiopia have been measured through a recall question in the phone survey.
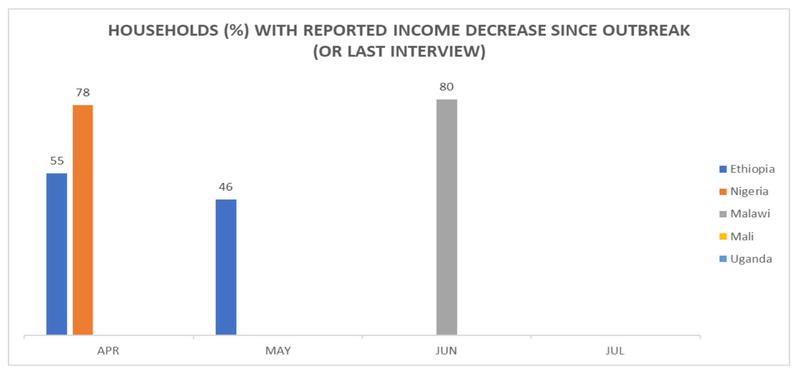
Income: Household income has significantly decreased during the COVID-19 crisis in Ethiopia, Nigeria and Malawi, unfortunately, data from other countries are not quite comparable. Figure 2 shows the percentage of households that reported decreases in household income since the beginning of the COVID-19 crisis (first survey wave) or since the last interview (subsequent survey waves).[5] From these data, we can infer that a significant share of the population—between 46 and 80%—had to get by with less income in these three countries. In Ethiopia, the share of households reporting income loss has further increased from April to May.
Note that this question does not ask people how much their income has changed. We recommend asking for absolute values of income in a fixed reference period (last week or month) which would simplify the interpretation of income changes.
Figure 2: Household income
Source: LSMS-Supported High-Frequency Phone Surveys on COVID-19[6]
3.1.2. Country-specific findings[7]
Ethiopia: Employment rates have recovered quickly after the COVID-19 lockdown. Jobs in trading/retail and hospitality sector in particular have picked up quickly, while those in transportation and construction recovered less from April to May.
Nigeria: Like Ethiopia, Nigeria has experienced a similar recovery of employment over the last months, but with higher employment in rural areas (84%) than in urban areas (73%). This development may reflect that people in rural areas tend to work in agriculture which faces fewer constraints than city-bound employment in offices, hospitality, transportation, and construction. Despite the recovery of employment, only 34% of respondents have continuously worked since mid-March, while 66% have experienced at least some time out of work.
Mali: Unfortunately, the World Bank’s May and June reports on Mali do not present directly comparable data on employment and income changes. For employment levels, Mali does not report the share of people working, but rather the share of people who lost their job due to COVID-19. In May, 13% reported that they lost their job due to COVID-19, in June this dropped to 11%. While this figure tells us something about how many have lost their jobs, we do not know the share of people not employed before COVID-19 and we are therefore unable to compare employment levels in Mali with other countries. However, the data suggest that job loss in June was of roughly the same magnitude as in other countries.
For changes in household income, the World Bank’s Mali report only documents income changes per income source and not changes in total income as depicted in the comparative chart. In May (first survey), 59% reported reduction or complete loss of income from agricultural activities, 79% from non-agricultural businesses and 60% from formal employment since the beginning of the crisis. According to the second survey in June, 49% reported income reduction or complete loss in agriculture, 57% from non-agriculture family businesses and 40% from formal employment since the last interview. These figures are hard to interpret – they could mean that some of those who suffered income loss in the first round had an even deeper income loss in the second round, or that additional people suffered income loss in the second round. However, we do not know whether incomes have recovered for some groups. We also suspect that this question is easy to misunderstand, and that respondents may report changes since the COVID-19 outbreak rather than since the last interview. If that is the case, the figures indicate a positive development over time.
Uganda: Income data for Uganda are not directly comparable with those depicted in the chart, this is because the World Bank’s Uganda report documents the share of those with reduction of income from at least one source of income and not reduction in total income. Since a reduction in one income source can be offset by increase in other income sources, this indicator is not directly comparable to those above. 87% of households report a reduction or total loss of income from at least one of their income sources. This indicates a severe impact compared to the data in Figure 2.
3.2. Food security
3.2.1. Comparative findings
Did food insecurity increase as a result of COVID-19 and associated lockdowns, following reductions in household incomes and disruptions in food supply chains?
Food insecurity exists when households are not able to access and consume adequate amounts of food, in terms of both quantity and quality. We observe the following: First, the level of food insecurity before and during the COVID-19 crisis has been very high. Second, there is no evidence that food insecurity increased over time as the COVID-19 pandemic progressed. This may be surprising but is consistent with theoretical predictions that poor households will do what they can to maintain or smooth food consumption. When facing reduced incomes, they will first reduce consumption of other goods, and they may also turn to crisis level coping strategies—such as selling assets—to maintain food consumption, even if this has long term welfare consequences. In addition, it is possible that most of the economic activities that poor households depend on, such as informal trading or informal sector employment—which takes up more than 90% of employment in some countries—may not have been affected as much as formal sectors. A recent report about the impact of COVID-19 in the Sahel suggests that markets have largely remained open despite lockdown regulations and there is limited adherence to lockdown measures, which has limited the negative socio-economic impacts on households.[8]
We review food security data from both the World Bank and the World Food Programme. The WB collects data on the proportions of households that ran out of food in the last 30 days. This is a useful indicator of food insecurity in terms of quantity. However, it does not capture food quality or the diversity of nutritional intake. Food or dietary diversity is critical for good health and requires that households consume adequate amounts of food from major food groups such as proteins, carbohydrates, and oils. The data from WFP provides an indicator for the “prevalence of insufficient food consumption” which captures both quantity and dietary diversity. It is defined as the proportion of people who are not able to consume staples and vegetables every day, or if they do, they only occasionally accompany it with oils and pulses, but have consumed no protein-rich food such as meat, fish, or dairy in the past 7 days.[9] The other advantage of the WFP data is that the food insecurity indicator is available every day for the period April to October, providing many time points for each country and thereby allowing us to assess trends.
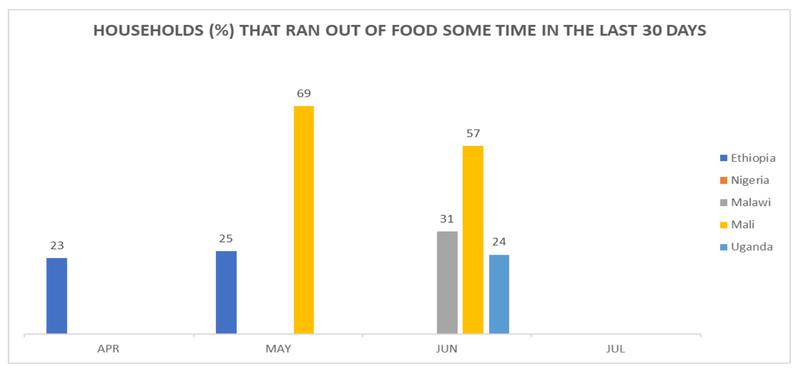
Households without food: Available data from the WB does not show any increase in the share of households who reported running out of food between April and June 2020; this share remains high throughout the whole period (Figure 3). In Mali, 69% of households reported in May that they had run out of food for at least some time in the previous 30 days. This share decreased to 57% in June, indicating an important improvement, yet food insecurity remains at very high levels. In Ethiopia, Malawi and Uganda, between 24% and 31% ran out of food according to the most recent estimates, with the highest figures in Malawi. Unfortunately, we do not have comparable data on pre-COVID-19 food security.
There is no consistent pattern across countries on whether households in urban or rural areas were more likely to run out of food. In Ethiopia, there was basically no rural-urban difference in April, while the problems increased among urban households in May (29% reported that they ran out of food, as compared to 22% among rural households). In Uganda urban households were also slightly more likely to report that they ran out of food (26% as compared to 23% among the rural households). However, Malawi shows the opposite trend and 23% of households ran out of food in urban areas, compared to 33% in rural areas.
While the poorest income groups are more likely to run out of food, a substantial share of households in the highest income group also reported that they ran out of food. In Uganda, 29% in the poorest quintile reported that they ran out of food, while the share was 17% in the highest income quintile. In Malawi, 42% ran out of food in the lowest income group, compared to 18% in the highest income group.
Figure 3: Households without food
Source: LSMS-Supported High-Frequency Phone Surveys on COVID-19[10]
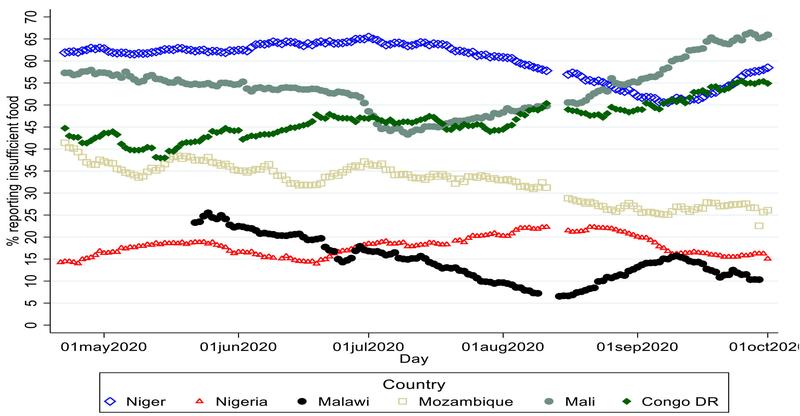
Insufficient food consumption: Overall, the WFP data shows that food insecurity largely remained unchanged, or was somewhat reduced, between 18 April and 1 October, albeit with periodical increases during this period (Figure 4). This is consistent with the WB data, although the WB data provides only two countries with more than one data point which makes interpretation over time more speculative.
More specifically, food insecurity in Mali declined between May and June, as measured by both the WFP (58% to 45%) and the WB (69% to 57%), and the drop was sustained into July (based on WFP data). However, after July food insecurity started rising again in Mali. Fortunately, we have access to individual level data from before the COVID-19 period in Mali. Analysis of these data for the period January to October 2020 in Mali shows that there was no change in food insecurity following the COVID-19 pandemic.
Figure 4: Insufficient food consumption
Source: Author computation from World Food Program data.
According to both WFP and WB data, the reported proportion of people with food insecurity in Malawi is much lower than in Mali. The WFP data show that the proportion of people experiencing food insecurity in Malawi fell steadily from around 25% at the end of May to less than 10% in August, after which it has increased somewhat again. Falling food insecurity may be related to the fact that Malawi recorded a bumper harvest of its main cereal in 2020.[11]
Niger has had the highest levels of food insecurity throughout the period, with the proportion of people having insufficient food consumption in the range 62-65% over the April—July period. Underlying individual level data which goes back to January suggests that there has been a modest increase in food insecurity (about 7 percentage points) since the time of the corona outbreak in March. A modest improvement in food security has taken place since June.
Mozambique has experienced a steady decline in the proportion of people reporting insufficient food consumption—from about 40% at the end of April to 25% in October. Individual level data from before the COVID-19 period in Mozambique (early March) also shows improvements in food security in the post COVID-19 period.
In Nigeria, food insecurity has remained relatively stable throughout the period, and at comparatively low level in this group of countries.
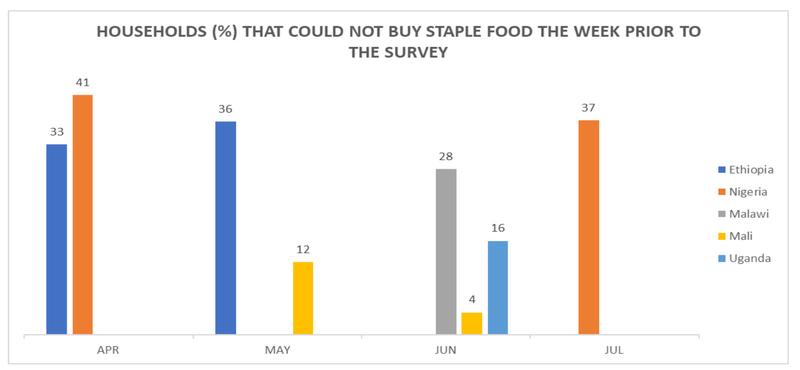
Access to staple food: According to WB data, significant proportions of households were not able to buy staple food the week prior to the survey (Figure 5). The data from April shows that 33% of households in Ethiopia and 41% in Nigeria were unable to buy staple food. Follow-up data suggests that access to food has either slightly deteriorated (36% in Ethiopia in May) or only marginally improved (37% in Nigeria in July). In the other countries in our sample—Mali, Malawi, and Uganda—the share of households unable to buy staple food is significantly lower, ranging between 4% and 28%. For Mali, we observe a significant improvement in food access from May to June (from 12% to 4% unable to buy staple food).
What is striking regarding Mali is that 69% in May and 57% in June reported running out of food. At the same time, an inability to buy staple food is very low (12% in May and 4% in June). We cannot explain this paradox with the currently available data. There are, however, a number of plausible explanations that may not be COVID-19-related. Generally, 75% of households in Mali rely on farming to feed themselves. Access to food through markets may thus be a less common concern.[12] Furthermore, the harvesting season in Mali starts in September, and food stocks tend to deplete in the months leading up to harvest.[13] Finally, the armed conflict between the government and rebels forced ca. 200,000 people to leave their homes and to give up their livelihoods, including farming, by the end of 2019.[14] These three factors may partially explain why food insecurity is high, while access to markets also remains high.
Figure 5: Access to staple food
Source: LSMS-Supported High-Frequency Phone Surveys on COVID-19[15]
The less than perfect correspondence between access to buying staple foods and other indicators of food security is also seen in other countries. For instance, it was reported above that in Ethiopia more households ran out of food in urban than in rural areas. When it comes to access to buying staple foods, the pattern is reversed and, aside from maize, shortages of staple foods are more prominent and worsening over time in rural areas.
Higher income groups also face difficulties in accessing staple foods. In Nigeria, 22% of households in the highest income quartile who needed to buy rice could not do it, while, as expected, the share who could not buy was even higher in the lowest income quartile, and accounted for 54%.
Note that access to food does not only reflect the availability of food at markets; across countries most respondents reported that they were unable to buy staple food because of a lack of money (household income), price increases and lack of transport.
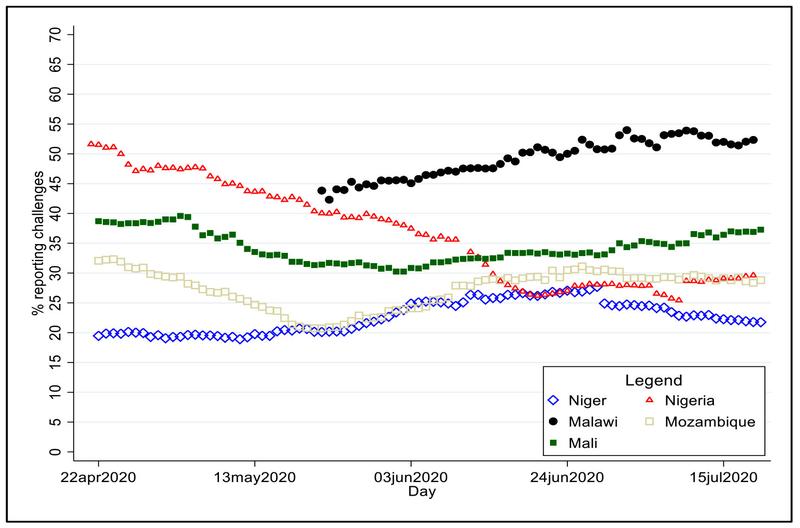
Access to markets: Limited access to staple food may partly result from challenges in accessing markets more generally. The WFP data also captures the proportion of people reporting challenges in accessing markets (Figure 6). This is a broader measure of access as it is not restricted to food, as in the WB indicator.
In general, the WFP data shows that the proportion of households with challenges in accessing markets fell between April and end of May in all countries (Nigeria, from 52% to 40%; Mali, from 38% to 30%; Mozambique, from 32% to 20%), or remained unchanged (Niger, at 20%). The trends in market access mirror trends in food insecurity shown in Figure 4. However, the share of people facing challenges in market access started increasing slightly again in some countries from end May (Mali, Malawi, and Niger). In Nigeria, the proportion of people reporting challenges in accessing markets continued declining (from 40% at the end of May to between 25-30% in June and July).
Figure 6: Challenges accessing markets
Source: Author computation from World Food Program data.
Across the countries, Malawi has the highest proportion of household reporting challenges in accessing markets, and similar to countries (except Nigeria), this proportion increased from the end of May to mid-July (from 44% to 53%). It is interesting that Malawi has the highest proportion of people reporting challenges accessing markets, yet also has the lowest proportion of people reporting insufficient food consumption. It is unclear whether this paradox can be explained by consumption of own production alone. However, we will see later (Section 3.5), that improved food security in Malawi is also associated with reduced use of crisis level coping strategies.
3.3. Coping strategies and social assistance
In the absence of adequate social protection or social insurance, most households facing income shocks adopt different coping strategies to maintain their food consumption. Coping strategies include, for instance, reducing certain types of consumption, selling productive assets, or borrowing at high interest rates. These coping strategies can have severe adverse long-term effects on households’ wellbeing.
WFP reports the proportions of households that use crisis level coping strategies (i.e., coping strategies with severe welfare implications), based on the reduced coping strategy index (rCSI).[16] WB indicators, on the other hand, are based on the percentage of people reporting the use of different coping strategies. Both WFP and WB indicators are useful in shedding light on the use of coping strategies.
3.3.1. Comparative findings
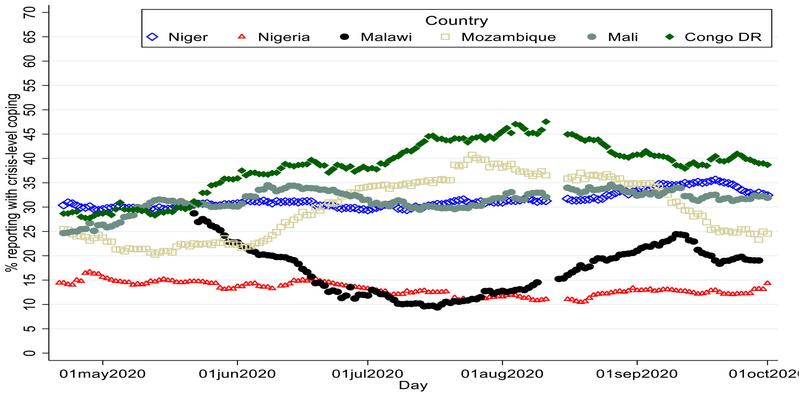
Crisis level coping strategies: In four out of the six countries, at least 30% of households have relied on crisis level coping strategies over the period April to October 2020 (Figure 7). Changes over time vary across countries. In Mali, Niger, and Nigeria, the percentage of people reporting crisis level coping strategies has broadly remained unchanged over time. In two countries (DRC and Mozambique), there was an initial increase up to late July/ August, followed by a decline. The opposite pattern is observed in Malawi. The fall in crisis level coping strategies in Malawi is consistent with improvements in food security as reported above. The DRC, Mali and Niger are countries with a consistently high proportion of people using crisis level coping strategies throughout the period. These are also the countries with highest food insufficiency (Figure 4).
Figure 7: Crisis level coping strategies
Source: Author computation from World Food Program data
Selling assets and reducing food consumption: The WB provides more disaggregated data on coping mechanisms. Here, we focus on two particularly severe coping mechanisms with potentially adverse long-term consequences for household wellbeing: (i) the sale of agricultural or non-agricultural assets and (ii) reduction of food consumption. Figure 8 shows the share of households (of those who experienced a reduction of income) that sold agricultural or non-agricultural assets. Between 1% and 17% of households reported to have sold assets. We observe diverging trends in Ethiopia and Nigeria. Ethiopia experienced a decrease from 4% who reported asset sales in April to only 1% in May. In Nigeria, however, the share that sold assets increased from 5% in May to 12% in July. This is a worrying development. Uganda reports 2% who sold assets in June.
Figure 8: Coping strategy – Sale of assets

Source: LSMS-Supported High-Frequency Phone Surveys on COVID-19[17]
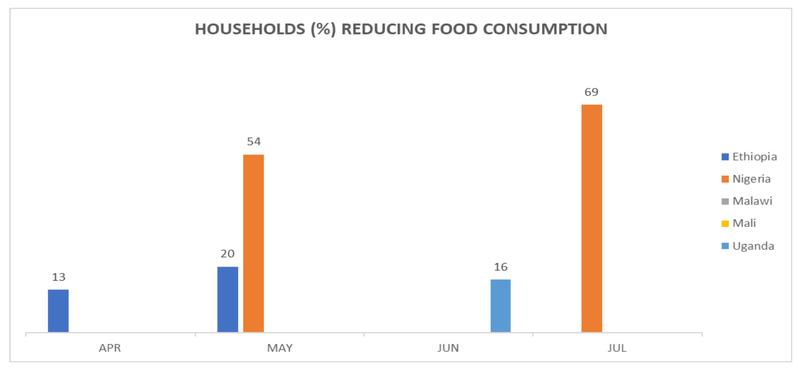
Figure 9 displays the share of households reporting a reduction in food consumption. Between 13% and 69% of households that experienced a reduction in income reduced their food consumption. In Nigeria, reduction in food intake is particularly widespread and increasing–54% reported food reduction in May and 69% in July. In Ethiopia, 13% reported reduced food consumption in April and 20% in May, also a significant increase. In Uganda, 16% reported reduced food consumption in June.
Both asset sales and reduced food consumption are severe coping measures in response to income loss. The data show that these severe measures are being used, and that the situation in Nigeria seems particularly severe. However, these data do not tell how much food consumption was reduced, from what level, and how frequently this happened. This may explain the apparent discrepancy between the high use of severe coping strategies in Nigeria in the WB data (e.g., Figure 9) with the lower prevalence of crisis level coping strategies in the WPF data (Figure 7) and the lower level of food insufficiency (Figure 4). Note that the WB data do not cover countries like Mali and Niger where crisis level coping strategies are more prevalent than in Nigeria (Figure 7), and where food insufficiency is more prevalent at the outset (Figure 4).
Figure 9: Coping strategy – Reduction of food consumption
Source: LSMS-Supported High-Frequency Phone Surveys on COVID-19[18]
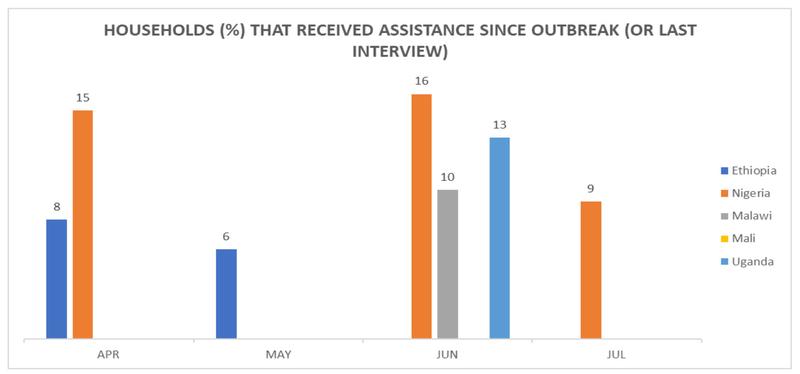
Social assistance: The previous section showed that the use of informal coping strategies is high overall. Societal welfare would be improved by replacing these inefficient informal insurance mechanisms with social insurance, e.g. income/cash transfers. States and communities have mobilized social assistance and resources to help those who are most heavily affected. Figure 10 shows that in the four countries where we have data, the share of the population that has received any type of assistance ranges between 6% and 16%. This is a low share compared to those who ran out of food or were unable to buy staple food.
Note that for most countries, the WB does not provide data on the share of the population that received assistance, but the share of the population that received specific types of social assistance, such as food aid, cash transfers or non-food transfers. Since, in principle, one household can receive several forms of assistance, it is not possible to calculate the aggregate based on these figures. In Figure 10, we assume for simplicity that there is no such overlap, and the figure thus shows the maximum share of the population that may have received assistance. The exception is Ethiopia, where the data represent the actual share of the population that received any form of assistance.
Nigeria stands out with the most comprehensive program for social assistance. In the first months of the crisis, 15-16% of Nigerian households reported to have received assistance, mostly food. However, the share of households that received food assistance decreased sharply from June to July. This is discomforting considering the increase in the same period – from 54% to 69% – in the share of the population with an income loss who reduced food consumption to cope with the crisis. In Ethiopia, 8% received social assistance in April, decreasing to 6% in May. Data for Malawi and Uganda are available only for June. In Malawi 10% reported to have received social assistance and in Uganda 13%.
Figure 10: Social assistance
Source: LSMS-Supported High-Frequency Phone Surveys on COVID-19.[19]
Note: Data show the share of households receiving any assistance (food aid, cash transfers, other in-kind (non-food) transfers).
3.4. Education
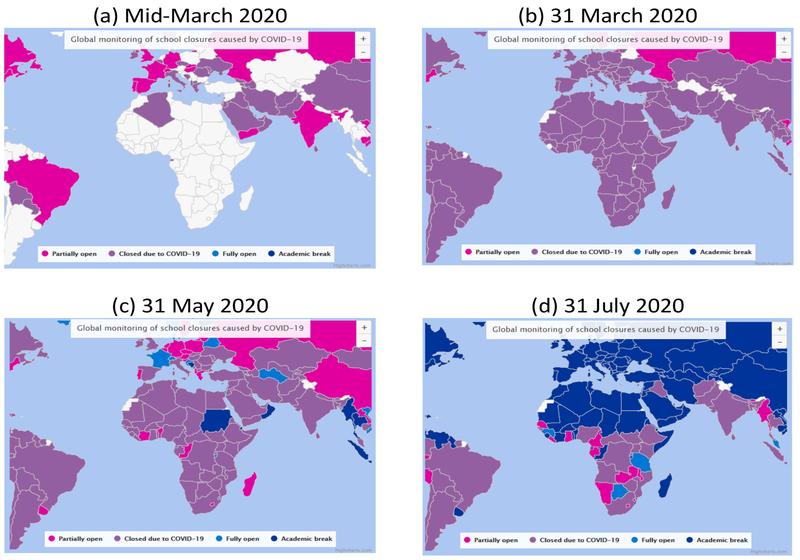
School closures were part of COVID-19 lockdown measures and had a direct impact on children’s education. While schools were still open in most African countries in mid-March, by the end of March schools were closed all over Africa (Figure 11). A few countries such as Benin, Cote d’Ivoire and the Republic of Congo partially re-opened schools during May, and a few others followed suit during June and July. However, most countries went from COVID-19-related school closures straight into the academic summer break. At the time of writing, only a handful of countries have fully opened their schools.
Figure 11: School closure status in Africa
Regarding the countries discussed in this report, Table 2 shows that schools have largely remained closed due to COVID-19 or the academic summer break between March and September. Schools were partially reopened in Malawi in July and Mali in June. At the time of writing, the schools are not open in any of the six countries analyzed in this report. WHO and UNICEF are however advocating safe school reopening in Africa after the summer break, emphasizing the adverse long-term impacts of continued closures on children’s education, nutrition, and wellbeing.[20]
Table 2: School status over time

Note: Status “closed” means closed due to COVID-19.
Source: UNESCO 2020 (https://en.unesco.org/sites/default/files/covid_impact_education.csv)
3.4.1. Comparative findings
Learning activities during school closure: Figure 12 shows children’s engagement in learning activities during COVID-19-related school closures. Even in the best-performing countries, Nigeria and Uganda, at best around six in ten households report that their children engaged in learning activities in the seven days prior to the survey.[21] In Nigeria, 62% of households with school children reported that their children engaged in educational activities in April. This level of engagement remained in June but dropped in July (54%). In Uganda, 59% of households with school children report educational activities, i.e. almost the same level as in Nigeria. The situation is much worse in Ethiopia and Malawi. In Ethiopia, 20% reported that their children engaged in learning activities in April and 32% in May, a significant increase, but this still only represents a third of households with school children. In Malawi, only 17% reported that their children engaged in learning activities.
What explains these stark differences between countries on the upper (Nigeria, Uganda) and lower bound (Ethiopia, Malawi)? Is this a reflection of pre-COVID-19 differences in educational quality? As a coarse proxy indicator for educational quality, we may use the literacy rate of people aged between 15 and 24 years. Only Uganda (89% in 2018) stands out positively in that regard. For Ethiopia (73% in 2017), Malawi (73% in 2015) and Nigeria (75% in 2018) these indicators are too similar to explain the differences in learning activities during COVID-19. We speculate that these differences may therefore reflect the capacity, adaptability, and preparedness for remote learning, as well as the supply and popularity of educational programs on radio and TV (which are the most common learning activities).
Figure 12: Learning activities during school closures
Source: LSMS-Supported High-Frequency Phone Surveys on COVID-19[22]
In most countries, engagement in learning activities was significantly higher in urban than rural areas. Table 3 displays the disaggregate results from the last waves of WB data. Mali is the only country where we do not observe a significant urban-rural difference. In other countries, the differences range from 11 percentage points (Uganda) to 27 percentage points (Ethiopia).
Similarly, there is a strong income gradient in the engagement in learning activities in favor of children from richer households. The difference in engagement in learning activities between the lowest and highest income group ranges from 18 percentage points in Malawi to 33 percentage points in Ethiopia.
Table 3: Engagement in learning activities, by urban/rural area and income group

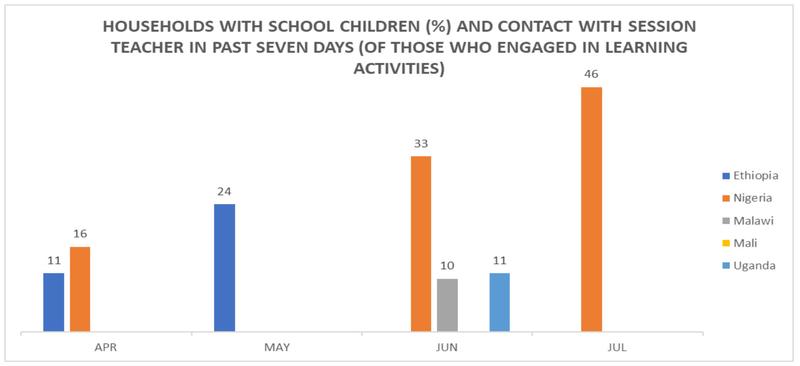
Contact with teachers: Figure 13 shows that between 10% and 45% of households whose children engaged in learning activities reported that there have been meetings with teachers within the last seven days. In Nigeria, the share of those in contact with their teachers has continuously increased from 16% in April, to 33% in June and 46% in July. In Ethiopia, contact with teachers appears to be on a similar trajectory as Nigeria, moving from 11% in April to 24% in May. Both Malawi (10%) and Uganda (11%) report comparatively low levels of direct teacher-student interaction in June.
Figure 13: Contact with teachers
Source: LSMS-Supported High-Frequency Phone Surveys on COVID-19[23]
3.5. Health care
COVID-19 may overwhelm health systems and restrict access to care for other health problems for a few reasons:because resources are drawn towards COVID-19-related activities, because people are discouraged from seeking health care to reduce the risk of COVID-19 infections, or because income loss or other constraints make it more difficult to access health care.
Both the WFP and WB collect data on the proportion of households who had challenges accessing health services when they needed them. While both the WFP and WB indicators focus on the people who needed care, WFP reports the proportion who had challenges accessing care, whether accessed or not, while the WB indicator shows the proportion of those in need of care who actually received treatment (although they may still have experienced challenges). We thus expect the WFP indicator to be higher than the WB indicator. This expectation is confirmed by the data; while the proportion of people who were not able to access care as captured by WB ranged from 8 to 26 percent, the people who reported challenges in accessing care ranged from 5 to 70 percent.
3.5.1. Comparative findings
Challenges accessing health services: Based on WFP data, the proportion of people reporting challenges in accessing health services has either increased or remained the same (Figure 14). Niger has had the highest share of people reporting challenges in accessing health services between April and July (59-65%), until it was overtaken by Nigeria later in July. Strikingly, the proportion of people reporting challenges in accessing health services in Nigeria sharply increased from 15% in mid-June to 70% in mid-July. Before mid-June, Nigeria had the lowest reported proportion of people reporting challenges accessing health services among the five countries. One month later, it had the highest proportion. The spike in challenges accessing health services corresponds to a sharp increase in COVID-19 cases in Nigeria in the same period.
Mali had the second highest (after Niger) level of this indicator for most of the period and experienced an increase in the proportion of people reporting challenges accessing health services from 32% in April to 55% in July. There was a very rapid increase from 33% at the beginning of May to 47% two weeks later.
Mozambique had a substantially lower proportion of people reporting challenges in accessing health services, between 21% and 26% over the period April to July 2020.
Figure 14: Challenges in access to health services
Source: Author computation from World Food Program data.
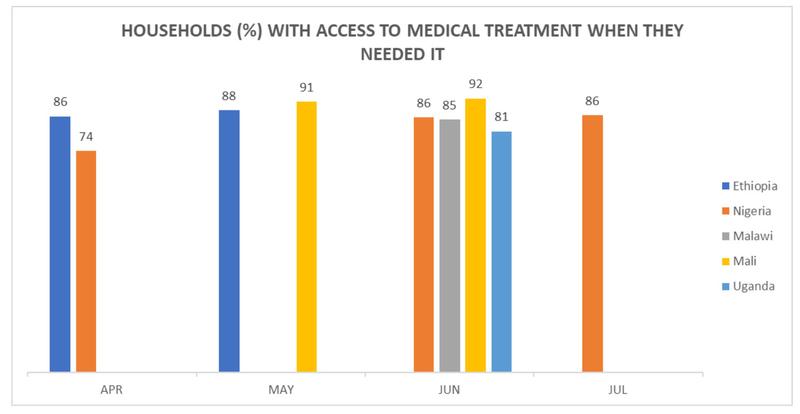
Needing and receiving medical treatment: While the WFP data shows that many households faced challenges in accessing health services, the WB data presents a more favorable perspective (Figure 15). Between 74% and 92% reported that they were able to receive medical assistance when they needed it. This figure appears to be relatively constant across countries and over time, except in Nigeria where the share was lower (74%) in April. However, access in Nigeria improved significantly to 86% in June and July.
Despite overall good access to healthcare, 10 to 15% of households do not have access. The most commonly reported reasons why people were unable to receive medical attendance include that they did not have the money, that medical personnel were absent, and that there were no means of transport.
Overall, and despite 10 to 15% being unable to get medical treatment, these findings suggest that access to health services has been maintained at a high level.
Figure 15: Access to medical treatment
Source: LSMS-Supported High-Frequency Phone Surveys on COVID-19[24]
3.5.2. Country-specific findings
The disaggregate findings at the country level show that the differences in access to health services between rural and urban areas are generally small, and that there is no consistent pattern of better access either in rural or urban areas.
Ethiopia: The aggregate access was stable from April (86%) to May (88%), but behind these figures we observe diverging trends in urban and rural areas. Rural access improved from 82% to 86%, while urban access declined from 93% to 90%, possibly reflecting an increase in demand in urban areas leading to capacity constraints.
Malawi: Regarding reasons why people could not access medical treatment, no medical personnel available was the most common report in both urban (30%) and rural (38%) areas, while lack of money was the second most reported reason with 21% in urban and 16% in rural areas.
Mali: There were only marginal differences between urban and rural areas in terms of reported access to medical treatment.
Nigeria: Access to child immunization services has been constrained. In July, one in five with children due for vaccination reported that they were not able to get their children vaccinated.
4. Recommendations
4.1. Potential areas of engagement for Norwegian development aid
Our analyses show that COVID-19 has affected key dimensions of people’s livelihoods, but in several areas the impacts seem less severe than expected.
- A significant share of the population was temporarily out of work and has lost income.
- Food insecurity is high in many countries. Even people in higher income groups report that they have run out of food.
- However, we do not observe a general increase in food insecurity in the wake of COVID-19.
- We observe frequent use of crisis level coping strategies, but not a general pattern of more use of such strategies after COVID-19.
- While social assistance programs have been implemented in several countries, the share of the population reached by such programs is much lower than those who report food insecurity.
- COVID-19 lockdowns have sent children home from school for six months in most countries, with limited access to learning activities.
- Access to health care for those who need it does not seem to have deteriorated significantly.
One area of potential engagement is to contribute to higher levels of food security. The need for improved food security extends far beyond the reach of current programs for social assistance. Food insecurity affects all income groups, and quite broad measures may therefore be needed to address the situation.
Among the countries studied in this report, DRC, Mali and Niger have particularly low levels of food security. However, these are also countries where it may be quite challenging to make significant progress due to ongoing conflicts. Meanwhile, several other countries are also suffering high levels of food insecurity.
Furthermore, the learning environment for school children depends crucially on which policies countries will follow regarding opening schools during the coming weeks and months. If schools continue to be closed, there is urgent need for measures to engage more children in learning activities. Among the countries we have studied, the needs are particularly large in Malawi and Ethiopia, and they are larger in rural than in urban areas.
If schools reopen, it will be essential to monitor to which extent children return to school and what the obstacles may be. The WB should include questions about these issues in future survey waves.
4.2. Continued monitoring
Data is still lacking from many countries, and the situation in the countries that have been monitored so far may change rapidly. We therefore recommend continued monitoring of both WB and WFP data during the coming months. Most WB surveys will be conducted for 12 months and will after some time allow for comprehensive analyses of developments across countries and over time.
4.3. Consider monitoring other important themes
While the WB and WFP surveys cover important themes, COVID-19 also affects development processes in many other areas. State-society relations, including governance issues, is one example. COVID-19 has led to rapid implementation of new forms of state regulations, and the long-term consequences of stricter enforcement of state powers is a potentially important aspect for future development. Other important areas include the development in the business environment in low-income countries in general, as well as the development of those industries that have been hardest hit by the lockdowns. The WB has implemented business surveys in some countries to monitor such issues.
At the household and community levels, other important aspects for people’s wellbeing include the prevalence of domestic violence/crime, mental health, and issues related to social cohesion. Domestic violence may increase during lockdowns as people are more likely to stay at home. Loss of employment and income and higher levels of uncertainty may affect mental health. Social cohesion can come under threat when scarce resources may have to be allocated in new ways. The introduction of more extensive social assistance programs may—if not implemented in a fair and transparent manner—undermine social trust and cohesion and thus also long-term social, political, and economic development.
4.4. Consider a special focus on people living in conflict and other marginalized populations
The current analysis of WB and WFP data provides data on key themes at the national level and for subsamples (e.g. income class, rural and urban areas). These data are currently not rich enough to assess the situation of particularly vulnerable groups. Households in conflict-affected areas or in politically and economically marginalized areas are examples. Such households are likely to face even more challenges than before the crisis, because these groups are often cut-off due to security concerns or do not have the political power and representation to direct government resources to their constituents, and it is therefore of particular importance to monitor the conditions of such groups.
It might be possible to extract data on vulnerable sub-groups by combining GIS data in the WB and WFP data sets with other georeferenced data sets that identify vulnerable populations (e.g. respondents living in areas with armed conflict events). In the case of small sub-groups, additional, targeted sampling and data collection may be needed to achieve a representative and robust sample.
Notes
[1] https://www.worldbank.org/en/programs/lsms/brief/lsms-launches-high-frequency-phone-surveys-on-covid-19
[2] https://hungermap.wfp.org/
[3] To be working is broadly defined in the survey questionnaires and includes formal and informal labor, farming, fishing or any other kind of income-generating activity. The exact wording (here from the Nigeria survey) is as follows: “Last week, that is from Monday [DATE] up to Sunday [DATE], did you do any work for pay, do any kind of business, farming or other activity to generate income, even if only for one hour?”
[4] https://www.worldbank.org/en/programs/lsms/brief/lsms-launches-high-frequency-phone-surveys-on-covid-19
[5] Respondents were asked about their household’s income sources (e.g. farming, non-farming, wage employment, remittances) and whether these have changed (increased, stayed the same or decreased) since the COVID crisis started (in the first survey wave) or since the last interview (subsequent survey waves).
[6] https://www.worldbank.org/en/programs/lsms/brief/lsms-launches-high-frequency-phone-surveys-on-covid-19
[7] Note that we only add country-specific findings when these bring additional value to the comparative findings, e.g. to emphasize more detailed results or to provide details on countries for which no comparative data are available but for which other relevant data have been reported.
[8] https://www.policycenter.ma/sites/default/files/PB-20-67_0.pdf
[9] We might expect the prevalence of food insufficiency measured by the WFP to be lower than the World Bank measure because the WFP looks at food insecurity in the last 7 days, as opposed to last 30 days in the World Bank measure. On the other hand, if these indicators had the same recall period, we would expect the WFP indicator to be higher since it includes not only those who had no meal but also those who could have had all meals, but their meals did not have adequate oils and pulses, and no proteins.
[10] https://www.worldbank.org/en/programs/lsms/brief/lsms-launches-high-frequency-phone-surveys-on-covid-19
[11] https://www.africanfarming.net/crops/agriculture/malawi-s-cereal-production-in-2020-estimated-at-bumper-level
[12] https://reliefweb.int/report/mali/10-choses-savoir-sur-la-faim-au-mali
[13] http://www.fao.org/giews/countrybrief/country.jsp?code=MLI
[14] https://www.refugeesinternational.org/reports/2019/12/17/crise-humanitaire-au-mali-surmilitarise-et-occulte
[15] https://www.worldbank.org/en/programs/lsms/brief/lsms-launches-high-frequency-phone-surveys-on-covid-19
[16] The rCSI measures the severity of the type of coping strategies and the frequency with which they are used. It is constructed from a battery of questions that asks whether a household had to rely on strategies such as selling assets, informal borrowing, reducing meals, and how frequent they did that over a specified period, normally 7 days. Each of these coping strategies has a weight reflecting their potential effect on future welfare of the household.
[17] https://www.worldbank.org/en/programs/lsms/brief/lsms-launches-high-frequency-phone-surveys-on-covid-19
[18] https://www.worldbank.org/en/programs/lsms/brief/lsms-launches-high-frequency-phone-surveys-on-covid-19
[19] https://www.worldbank.org/en/programs/lsms/brief/lsms-launches-high-frequency-phone-surveys-on-covid-19
[20] https://www.afro.who.int/news/who-unicef-urge-safe-school-reopening-africa
[21] The survey asks respondents with pre-COVID school children: “Have the children been engaged in any education or learning activities during the past 7 days?”
[22] https://www.worldbank.org/en/programs/lsms/brief/lsms-launches-high-frequency-phone-surveys-on-covid-19
[23] https://www.worldbank.org/en/programs/lsms/brief/lsms-launches-high-frequency-phone-surveys-on-covid-19
[24] https://www.worldbank.org/en/programs/lsms/brief/lsms-launches-high-frequency-phone-surveys-on-covid-19


