Household wellbeing and coping strategies in Africa during COVID-19. Updated Findings from high frequency phone surveys
2.2. Methodology and limitations
3.3. Coping strategies and social assistance
Crisis-level coping strategies
Figure 12: Percentage reporting challenges accessing health services when needed
How to cite this publication:
Peter Hangoma, Carlo Koos, Ottar Mæstad (2022). Household wellbeing and coping strategies in Africa during COVID-19. Updated Findings from high frequency phone surveys. Bergen: Chr. Michelsen Institute (CMI Report R 2022:07)
1. Executive summary
This report documents key aspects of household wellbeing in selected countries in sub-Saharan Africa (SSA) during the COVID-19 crisis. It expands the country coverage and time span of our previous report on the same topic, published in 2020. We present findings based on high-frequency phone surveys from the World Bank in nine countries (Ethiopia, Malawi, Mali, Nigeria, Uganda, Ghana Mozambique, DR Congo, South Sudan) and from the World Food Programme in seven countries (Malawi, Mali, Mozambique, Nigeria, Niger, DR Congo, Ethiopia). We have included data that was publicly available by the beginning of June 2021.
While the number of COVID-19 deaths has been modest in African countries compared to other parts of the world, there has been widespread concern about the socio-economic ramifications of the pandemic, including loss of employment and income, increased food insecurity, and reduced access to health and education services.
Our first report, covering the first months of the pandemic, documented a sharp loss of employment in the initial phase of the pandemic. Many households reported a loss in income. However, we did not find evidence of increased food insecurity, nor did we observe a general tendency toward increased use of crisis-level coping strategies in households. Access to health care also appeared to have remained relatively high.
In this report, we document how these outcomes have evolved over a longer time horizon. It may take time for loss in income to result in reduced food security, because households will use various coping strategies. We were therefore particularly interested in whether food security would deteriorate over time. We were also interested in whether the second wave of the pandemic, which hit Africa around December 2020-February 2021, had larger impacts than the first wave.
The data show a significant reduction in employment immediately following the onset of COVID-19, but almost all countries were able to recover within a few months. In fact, several countries have higher employment rates in the most recent survey than before the pandemic (DR Congo, Malawi, Nigeria, Ghana, Uganda). The second wave impacted employment rates less than the first wave. Nevertheless, we observe a reduction in employment in some countries in early 2021 (Ethiopia, Nigeria), while there was no reduction in others (Malawi, Uganda).
Data on income change are sparse, but the available data suggest that a high share of households have experienced reduced income over time. The magnitude of income losses is unknown, however, due to lack of data.
Food insufficiency has remained high in all countries from April 2020 to June 2021. However, there is no evidence in our data of major fluctuations or increases in food insufficiency after the outbreak. In most countries, food insufficiency has remained stable over time. Some smaller fluctuations over the year are most likely due to seasonal variations. Data on more severe forms of food insecurity, like someone having to skip food for a whole day, show lower prevalence than before COVID-19 in some countries (Ethiopia, Malawi, Mozambique, Uganda) but higher prevalence in others (Nigeria, South Sudan). Hence, there is no clear pattern across countries.
Reflecting a high level of food insufficiency, a large share of the various populations (20%-55%) used crisis-level coping strategies in the period from April 2020 to June 2021. There has been no consistent increase in the use of such strategies, however. While the use of crisis-level coping strategies increased in some countries (Nigeria, DR Congo), there was a decline in others (Mali, Niger). In other countries, variations over time appear to be caused by seasonal patterns.
Schools were fully closed from two to six months. From October 2020 to June 2021, schools were partly open in all countries, but fully open only in a few places from February/March onwards.
Access to health care has remained relatively high throughout the pandemic. According to the latest data, at least 90% received health care when needed, except in conflict-affected countries like DR Congo and South Sudan. DR Congo is the only country which has experienced a decline in access to health services in the period, though people in a few other countries also report having more challenges in accessing these services now than before the pandemic (Nigeria, Mali). In other countries, fewer people report having such challenges (Niger, Malawi, and Ethiopia).
In conclusion, COVID-19 has negatively affected key dimensions of people’s livelihoods, but in several areas the impacts seem less severe than expected. The second wave of the pandemic seems to have had smaller effects on people’s livelihoods than the first wave, even if its health impacts were more severe. Finally, the socio-economic situation varies markedly across countries, for instance in terms of food insufficiency. This was the case before COVID-19 and is still the case. These differences are probably more important indicators of the need for support than of the particular disruptions that have occurred because of the pandemic.
2. Introduction
2.1. Background
COVID-19 and lockdown measures have affected people’s income and livelihoods, including access to health care, markets, and education. To develop an appropriate policy response to this precarious situation, it is crucial to monitor the situation on the ground with timely and representative household data.
This report aims to provide policy makers with the most recent data on household wellbeing and coping strategies in Norwegian partner countries, as well as other countries of particular interest to Norwegian development policy in sub-Saharan Africa. Our focus is on employment and income, food security, coping mechanisms, and on access to education and health care.
2.2. Methodology and limitations
The analyses in this report are based on two main sources of quantitative data: (i) the World Bank’s LSMS-supported High-Frequency Phone Surveys on COVID-19[1] (henceforth WB data) and (ii) the World Food Programme’s phone surveys[2] (henceforth WFP data). Both WB and WFP data aim to provide near real-time data on household wellbeing and coping strategies. Both data sources aim to be representative at the national level, which makes these data particularly valuable for policy makers.
Data coverage
Table 1 below shows the country coverage of the two data sources in relation to a list of countries in SSA that are of particular interest in relation to Norwegian development cooperation. The World Bank surveys cover the full list of countries, while the WFP surveys cover all countries except Ghana and South Sudan. However, data is not available for all countries. The report is based on data available as of 5 June 2021 (see table 1).
Table 1: Countries covered by WB and WFP surveys
|
|
World Bank surveys |
World Food Programme surveys |
|
DR Congo |
Yes (until 11/2020) |
Yes |
|
Ethiopia |
Yes (until 02/2021) |
Yes |
|
Ghana |
Yes (until 06/2020) |
No |
|
Malawi |
Yes (until 01/2021) |
Yes |
|
Mali |
Yes (until 07/2020) |
Yes |
|
Mozambique |
Yes (until 10/2020) |
Yes |
|
Niger |
Yes (not available) |
Yes |
|
Nigeria |
Yes (until 03/2021) |
Yes |
|
Uganda |
Yes (until 02/2021) |
Yes, but no data |
|
Somalia |
Yes (not available) |
Yes |
|
South Sudan |
Yes (until 06/2020) |
No |
|
Tanzania |
Yes (not available) |
Yes, but no data |
Sampling
The WB and WFP data differ in how they construct their samples. The WB surveys draw on recent Living Standards Measurement Survey (LSMS) samples that, in most cases, were used for surveys in 2018 or 2019. The WB aimed to re-contact all respondents from these previous surveys, but reports have shown that a significant share (5-30%) could not be contacted by phone. The sample sizes of the WB data vary between 1,000 and 1,600 respondents.
The WFP does not draw on any preexisting sample frame but uses techniques such as random digital dialing or customer databases from mobile phone service providers to build its sample. The WFP surveys report daily data, which allows WFP to assess trends in real time. They interview around 32 randomly selected persons per day per country and use a rolling sample where each household is re-interviewed a few times (with a gap of 1 to 3 months between interviews) before being replaced with another household.
Data preparation
While the WFP data were available in ready-to-use format containing data points across the covered countries and months, we had to construct the WB dataset to include multiple countries and survey waves. The actual data collection has been done by the national statistics offices in most countries. Consequently, the general availability of survey data, the types of indicators collected in each survey wave and the structure of the data differed significantly across countries. Our goal was to provide a cross-country perspective over time to assess differences between countries and temporal trends. We assembled a time-series, cross-country dataset for the World Bank surveys that covers Norwegian partner countries. Given that the data availability was patchy, we applied the following strategy to assemble a dataset that is as comprehensive as possible while maintaining high standards of consistency.
- Cross-country harmonized dataset:
As a basis, we used a recent dataset by the WB that combined and harmonized the individual country-level survey waves into a harmonized and merged dataset.[3] The coverage of this dataset differs significantly across countries and indicators. - Supplement missing data with survey report on key indicators
To account for missing data in more recent waves that have not been included in the above-mentioned dataset, we manually complemented this data with data from summary tables and survey reports on key indicators published by the World Bank.[4] - Supplement with raw microdata
We further filled missing data gaps by looking into each available individual, raw microlevel dataset, which was often more up to date than the harmonized cross-country dataset.[5] - Pre-COVID data
The surveys did not include pre-COVID data. Hence, we complemented these as far as possible from different sources, including LSMS surveys and data by FAO.
To merge and analyze the data we used STATA 15. The code and datafiles are available upon request from the authors.
Limitations
While both WB and WFP provide unique data during COVID-19, both come with important limitations. Phone surveys are a particularly challenging way of collecting high-quality data. First, logistical and technical challenges including poor network coverage and related audio quality may impair the quality of the interview. Second, the lack of personal face-to-face contact can make it difficult to establish sufficient rapport between the enumerator and the respondent. This distrust may bias responses to potentially sensitive questions, especially in autocratic or war-affected contexts. Third, many key questions in the WB questionnaires differ slightly across countries, which makes cross-country comparisons more difficult. This is one of the reasons why we cannot report data for some countries in the comparative charts in this report, although surveys have been implemented. Fourth, while COVID-19 has plausibly affected many of the indicators we discuss, changes that occur from before, during and after COVID-19 are not necessarily only the result of COVID-19. Other factors could also be at play that affect the indicators, such as violent conflict. Hence, we caution against interpreting changes in the presented indicators as necessarily reflecting the causal impact of COVID-19.
3. Findings
The findings are summarized along the following themes: employment and household income, food security, coping strategies and social assistance, education, and health care. For each theme, we provide one or more comparative charts for key indicators across countries and over time, and briefly discuss common trends or divergences.
3.1. Employment and income
Employment
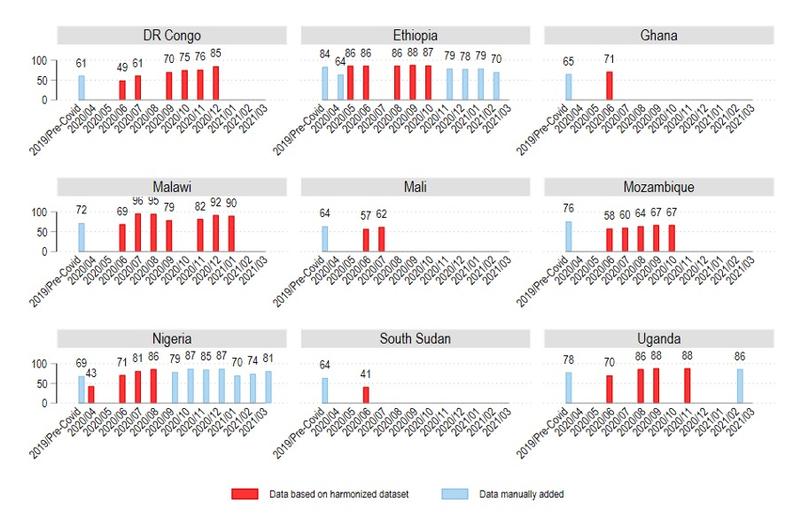
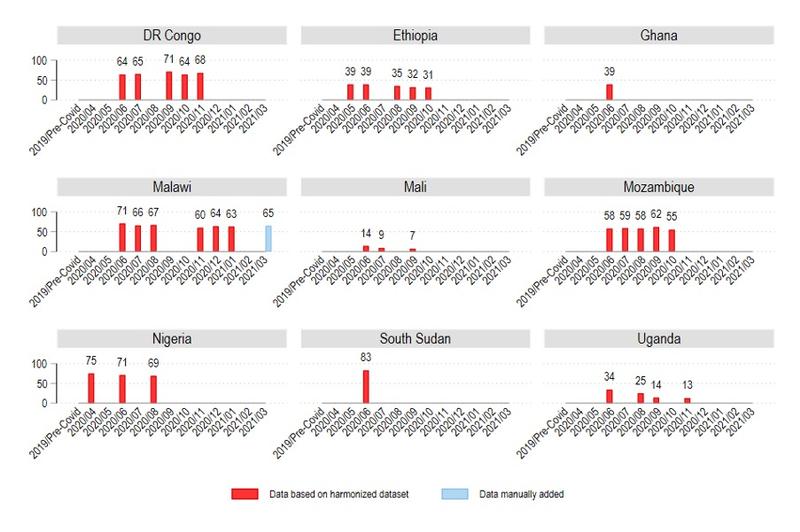
In Figure 1 we present the share of respondents (above 18 years) that is currently working across countries and over time. This question refers to all types of income-generating employment and working activities and includes both the formal and informal sector.
After the lockdowns in March 2020, employment levels dropped significantly. This pattern is best observed for countries where pre-COVID data and April and May data are available. For instance, in Ethiopia, employment fell from 84% pre-COVID to 64% in April 2020. Similarly, in Nigeria employment dropped from 69% pre-COVID to 43% in April 2020. This pattern can be observed to a lesser extent for countries that started data collection later into the pandemic: DRC from 61% pre-COVID to 49% in June 2020, Malawi from 72% pre-COVID to 69% in June 2020, Mali from 64% pre-COVID to 57% in June 2020, Mozambique from 76% pre-COVID to 58% in June 2020, South Sudan from 64% pre-COVID to 41% in June 2020, and Uganda from 78% pre-COVID to 70% in June 2020. Ghana is an exception and experienced a rise in employment from a pre-COVID employment of 65% to 71% in June 2020.
Looking further into employment rates in fall 2020 and early 2021, the data show that employment levels have recovered in most countries, except in Mozambique where employment remains significantly below pre-COVID levels.
The second wave of the pandemic has not left a consistent pattern in employment data across countries. In some countries, we observe a decline in employment following the second wave. On the one hand, Ethiopia had high employment rates in the fall 2020 (up to 88%), falling to 70% in February 2021, which is significantly below pre-COVID levels. A dip in employment rates was also observed in Nigeria in early 2021, but they did not drop below pre-COVID levels. On the other hand, there are no indications of reduced employment in early in 2021 in Uganda and Malawi. Data for other countries are lacking.
In several countries, the most recent data show higher employment rates than before COVID-19 lockdowns (DR Congo, Nigeria, Malawi, Uganda). This can reflect that there are more jobs and work, but it might also reflect that there are more people who work, but that each of them work less than before COVID-19. Unfortunately, the way in which the survey questions were asked does not allow us to assess this important question. We recommended to the WB that they include more precise questions about the type and extent of employment to assess such questions in the future.
Figure 1: Employment
Household income
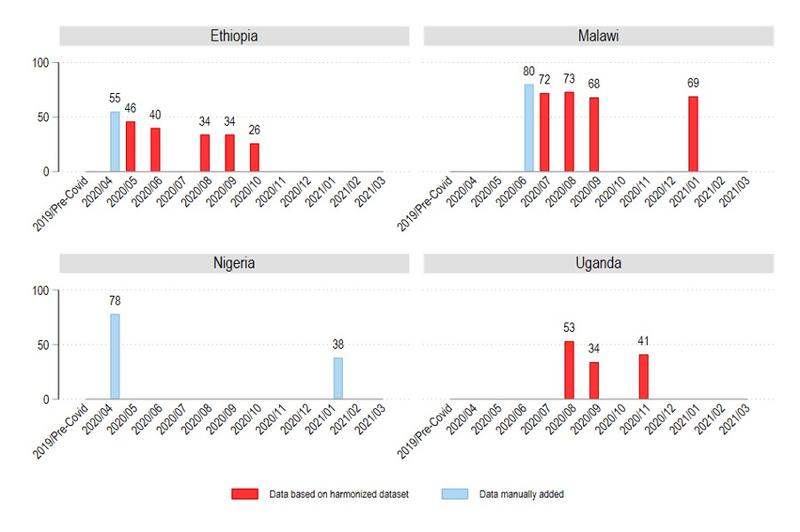
Income data are available for only four countries. Figure 2 shows the share of households experiencing a decrease in total income since the last interview across countries and time.
Overall, at least half of respondent households experienced decreases in total household income in the first months of the pandemic. These decreases in income become less prevalent over time in all four countries for which we have data, but remain at high levels. Specifically, in Malawi the share of respondents reporting income decreases stabilized at 70%.
This indicator does not give us information about the magnitude of income losses. Nevertheless, household income normally correlates with employment. Why do we observe increasing employment levels and income loss simultaneously for the four countries? One plausible explanation is that, as suggested above, more people work less and therefore earn less income. Another explanation might be that farmers were not able to sell their produce, or sold it for a lower price than before, because lockdowns curtailed market activities.
Figure 2: Household Income
3.2. Food security
Food insecurity exists when households are not able to access and consume adequate amounts of food, in terms of both quantity and quality. We observe the following: First, the level of food insecurity before and during the COVID-19 crisis has been very high. Second, there is no evidence that food insecurity increased over time as the COVID-19 pandemic progressed.
We review food security data from both the World Bank and the World Food Programme. The WB collects data on the proportions of households that ran out of food in the last 30 days. This is a useful indicator of food insecurity in terms of quantity. However, it does not capture food quality or the diversity of nutritional intake. Food or dietary diversity is critical for good health and requires that households consume adequate amounts of food from major food groups such as proteins, carbohydrates, and oils. The data from WFP provides an indicator for the “prevalence of insufficient food consumption” which captures both quantity and dietary diversity. It is defined as the proportion of people who are not able to consume staples and vegetables every day, or if they do, they only occasionally accompany it with oils and pulses, but have consumed no protein-rich food such as meat, fish, or dairy in the past 7 days. The measure combines those with moderate as well as severe food insufficiency.
The other advantage of the WFP data is that the food insecurity indicator is available every day for the period April 2020 to June 2021, providing many time points for each country and thereby allowing us to assess trends.
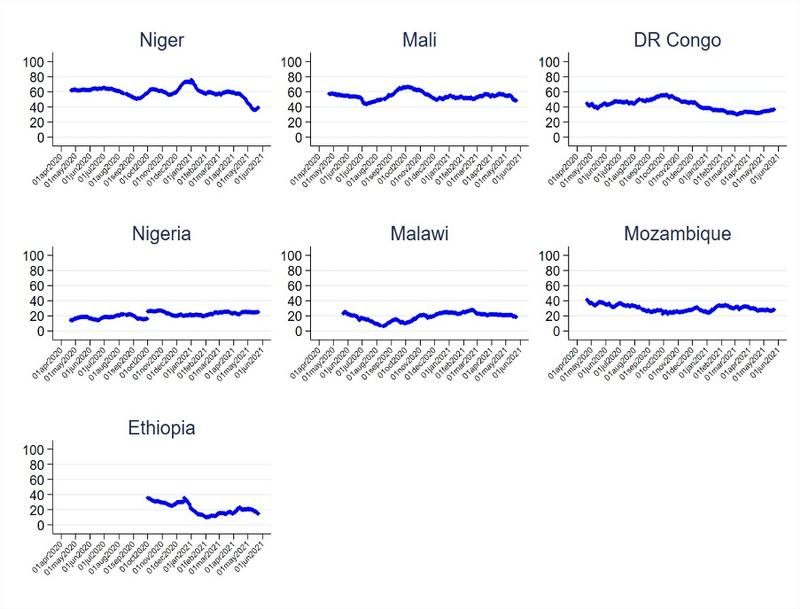
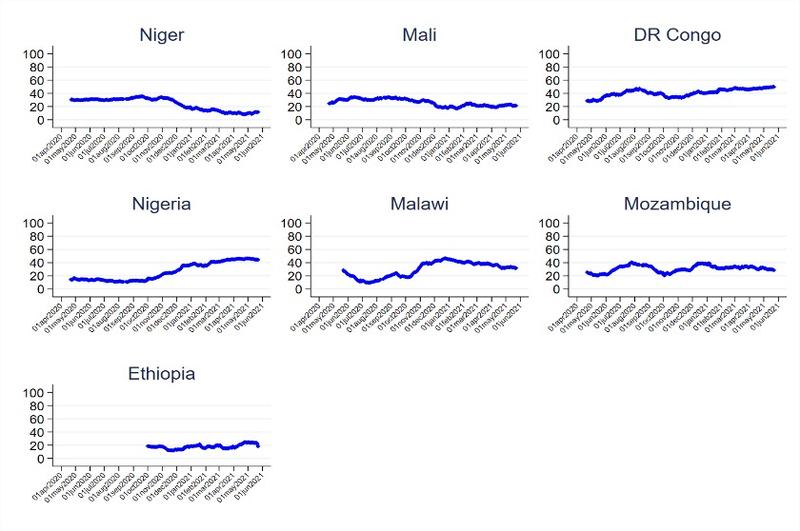
Moderate and severe food insecurity: First, food insecurity has been high in all countries throughout the period April 2020-June 2021 (Figure 3). Second, there is no evidence of major fluctuations or increases in food insufficiency more than one year into the COVID-19 pandemic. There are normally seasonal fluctuations in food security, as households typically have lower food consumption in lean seasons. But if we compare the share of households with food insufficiency in the same seasons or months, we see that food insecurity did not change.
For example, the share of people with food insufficiency in Niger in May-June 2020 was the same as that in May-June 2021 at around 60% (in fact, in June 2021, there was a sharp reduction in food insufficiency to 40%). The patterns were similar in Mali, with prevalence of food insufficiency at around 60% in April-June 2020 and remaining the same in April-June 2021.
In DR Congo, food insecurity was gradually increasing over the period April-October 2020 and then started reducing. While the proportion of people with food insufficiency in the period April-June 2020 was just over 40%, it was under 40% in the same period in 2021. Food insufficiency remained almost unchanged in the period April 2020-June 2021 in Nigeria at around 20%. The prevalence of food insufficiency was also an average of 20% in Malawi throughout the period April 2020-June 2021, with the rate in June 2020 being similar to June 2021.
Mozambique and Ethiopia seem to have been experiencing reductions in food insufficiency throughout the period, although the data for Ethiopia is only available for the period October 2020-June 2021, which makes it hard to check for seasonal patterns.
Since these data do not cover the period before the outbreak of COVID-19, they cannot tell us whether there was any abrupt change in food insufficiency at the time of the outbreak. However, since we would expect households to use various coping strategies in the short run to maintain food consumption, we do not expect abrupt changes in food insufficiency but rather a gradual deterioration over time. Overall, we do not observe such a pattern, though.
Figure 3: Percentage of people with insufficient food consumption
Days without food: As an alternative measure of food insecurity, the WB surveys asked how many days at least one person in the household went without food for a whole day in the past 30 days. In Figure 4 below, we present the percentage of households reporting that someone went without food.
There is a large variation across countries. Food insecurity, according to this measure, is relatively high in DRC, Malawi, Mozambique, Nigeria, and South Sudan, where more than 30% of households had someone who went without food in (part of) this period. At the other end of the spectrum, Ghana, Mali, Ethiopia, and Uganda report comparatively low levels of days without food.[6]
In several countries, the WB also collected data on days without food before COVID. Comparing pre- and post-COVID data, we observe a significant increase in this measure of food insecurity only in South Sudan and Nigeria. In Ghana and Ethiopia there is barely any difference, and in Malawi, Mozambique, and Uganda, we observe fewer households reporting days without food after the outbreak of the pandemic. Like the WFP data, these data thus suggest that the pandemic is not associated with an overall increase in food insecurity across countries.
The data suggest that there may have been other factors that have contributed to improved food security in this period, and that in several countries these factors have outweighed negative impacts of COVID-19 if any.
Figure 4: Days without food
Skipping meals: The WB survey also included a food security measure that asked respondents whether someone in the household had to skip a meal in the past 30 days. Figure 5 shows the percentage of households answering in the affirmative to this question. Since this is a less extreme indicator than going without food for a whole day, we observe higher rates. But essentially, the differences across countries and over time are in line with the previous indicator.
Figure 5: Skipping meals
3.3. Coping strategies and social assistance
In the absence of adequate social protection or social insurance, most households facing income shocks adopt different coping strategies to maintain their food consumption. Coping strategies include reducing certain types of consumption, selling productive assets, or borrowing at high interest rates. These coping strategies can have severe adverse long-term effects on households’ wellbeing, investment and consumption, education, and health.
Crisis-level coping strategies
WFP reports the prevalence of crisis-level coping strategies, i.e., the proportion of households that use coping strategies with severe welfare implications, using the reduced coping strategy index (rCSI).[7] The rCSI measures the severity of the type of coping strategies and the frequency with which they are used. The rCSI is constructed from a battery of questions asking whether a household had to rely on coping strategies such as selling assets, informal borrowing, reducing quantity or quality of meals, and how frequently they used these over a 7-day period.
Between 20% and 55% of households surveyed used crisis-level coping strategies when faced with food insufficiency between April 2020 and June 2021 (Figure 6). Changes over time vary across countries. In Mali and Niger, the percentage of people reporting crisis-level coping strategies was around 30% between April and December 2020 and then started falling and stabilized at around 20% in Mali and 15% in Niger.
Nigeria shows a different pattern; starting from around 20% the prevalence of crisis-level coping strategies increased sharply from around October 2020 to as much as 40% in the period January-June 2021. An even bigger increase has been observed in DR Congo: from around 25% in May-June 2020 to around 50% in the same period in 2021.
In Malawi, the increase in crisis-level coping beginning around September/October 2020 corresponds to the height of the lean season. We see, however, that after a peak of 41% in January 2021, there is gradual reduction in crisis coping and the rate for June 2021 was the same as June 2020 (about 25%). In Mozambique, crisis-level coping increased from 20% in June 2020 to 40% in August 2020 but started reducing again before stabilizing to under 40% in the period January-June 2021.
The prevalence of crisis-level coping remained stable in Ethiopia (around 20% over the period October 2020—June 2021).
Figure 6: Percentage of people with crisis–level coping strategies
Social assistance
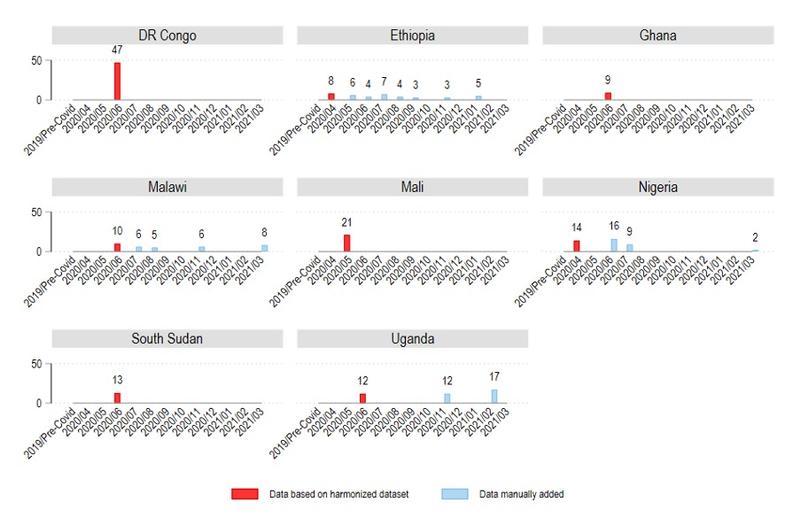
Social assistance by governments and non-state actors (e.g., NGOs, churches) provides households with food, cash, or in-kind contributions to deal with shocks. Assistance can reduce the pressure to engage in crisis-level coping such as reducing food consumption and the sale of assets. Figure 7 shows the share of households that reported to have received any kind of assistance since the last interview.
We observe that in all countries social assistance is being provided to households. However, the share of households receiving assistance varies extensively across countries and is relatively stable over time. While in DRC and Mali a comparatively high share receives assistance (47% and 21% in May/June 2020), assistance coverage in Nigeria, Uganda, and South Sudan peaks at 16%, 13%, and 17%. The lowest coverage is observed in Ethiopia (3-8%), Ghana (9%), and Malawi (5-10%). These differences in assistance coverage broadly matches reported levels of moderate and severe food insecurity by WFP (see Figure 3).
Figure 7: Social assistance
3.4. Education
School closures
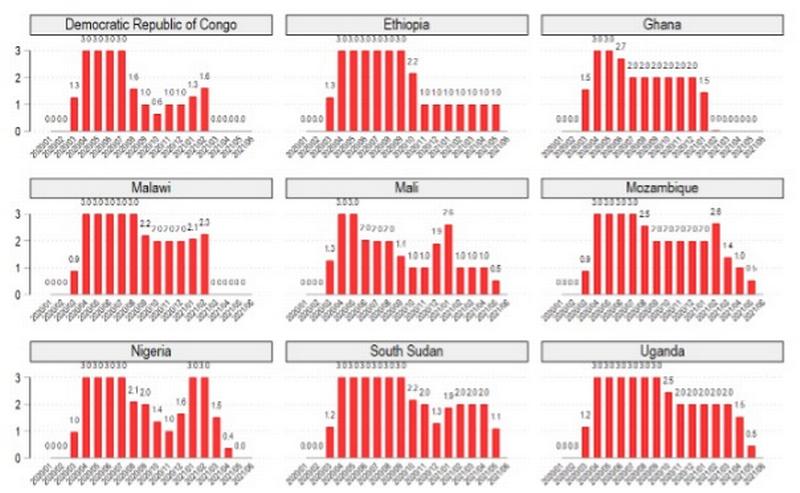
To analyze the extent of school closures across countries and over time we rely on data from the Oxford COVID-19 Government Response Tracker 2021[8]. These data measure on a weekly basis whether schools were open with no measures (0), closings were recommended (1), school closings were required for some levels/schools (2), or all schools were closed (3). Based on these weekly data, we calculate the average monthly school closing level with is a value between 0 (i.e., schools open) to 3 (i.e., all schools closed). Higher values thus reflect more school closures. Figure 8 shows the development over time.
The general pattern is that all countries closed all schools during the first months of the pandemic, especially during the second half of March, April, and May. Ghana and Mali shifted comparatively early to level 2, which allowed some levels (e.g., just high school) or school types (e.g., just public schools) to open. After the summer break 2020, most countries shifted at least to level 2, but DRC, Ethiopia and Mali further reduced to level 1 (recommended closure). At the time of data collection for this report in June 2021, only DRC, Ghana, Malawi, and Nigeria had lifted all limitations (level 0).
Figure 8: Monthly average school closing level
Learning activities
To what extent did children have access to learning activities during school closures? The WB surveys asked respondents with school-aged children in what types of learning activities their children were engaged in. Figure 9 presents the share of households with school-aged children who engaged in any learning activity (e.g., teacher assignments, educational TV or radio, apps).
Children’s engagement in learning activities varies significantly across countries but remains relatively stable over time. Overall, children’s learning engagement is worryingly low. At the lowest margin, well below 50% of school-aged children who went to school before COVID-19 in Ethiopia, Malawi, Mali, and South Sudan engage in any learning activity. At the upper end, above 50% of children in DRC, Ghana, Nigeria, and Uganda used different types of learning opportunities. Mozambique shows surprisingly high levels of engagement.
Figure 9: Children’s engagement in learning activities
While the previous indicator gives us an overall impression of the availability and uptake of extra-curricular learning opportunities, it does not tell us much about the type and quality of educational activities. For some countries the WB provides more detailed information. We focus here on the share of children who finished assignments by teachers, an arguably higher quality of learning opportunity reflecting schools’ commitment to continue learning during lockdowns and teachers’ engagement.
Figure 10 shows that the share of households with children completing assignments is far lower compared to the previous indicator “any learning activity” reported above. The indicator varies significantly across countries as well as over time. Overall, only a small share of children completes assignments by teachers. In the best performing country, Nigeria, at best only 27% engage in this type of learning activity. In all other countries, the share is far below. In DRC, Ethiopia, Ghana, South Sudan, and Uganda up to 14% complete assigned tasks. In Malawi and Mali these rates are extremely low, between 1 and 4%.
Figure 10: Children completed assignments

3.5. Health care
COVID-19 may overwhelm health systems and restrict access to care for other health problems for several reasons: because resources are drawn towards COVID-19-related activities, because people are discouraged from seeking health care to reduce the risk of COVID-19 infections, or because income loss or other constraints make it more difficult to access health care.
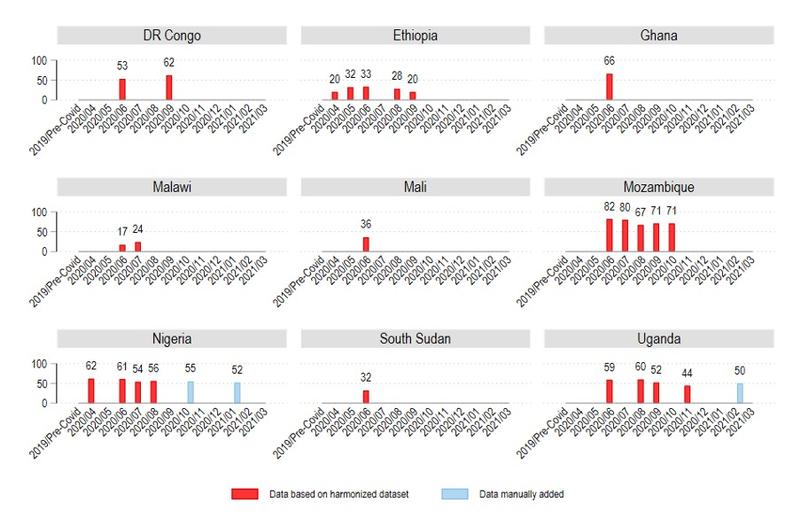
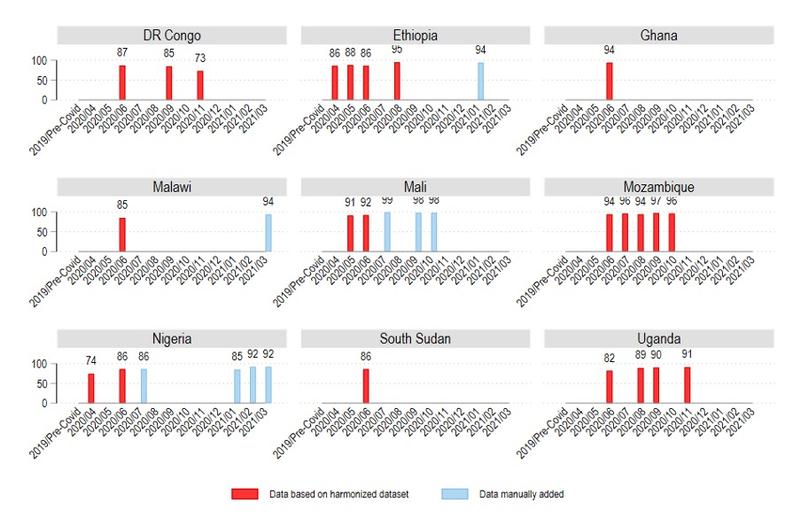
Figure 11 presents the share of households who received medical attention when needed. Against general expectations that health care access is seriously curtailed by COVID-19, reported levels of access to health care when needed is high across countries and relatively stable over time. According to the latest data points, at least 90% received health care when needed in all countries except in conflict-affected countries like DRC and South Sudan. While the results are generally reassuring, the data do not allow us to assess to what extent access to non-acute preventive medical services such as pre-natal monitoring and child vaccination has been affected.
Figure 11: Received health care when needed
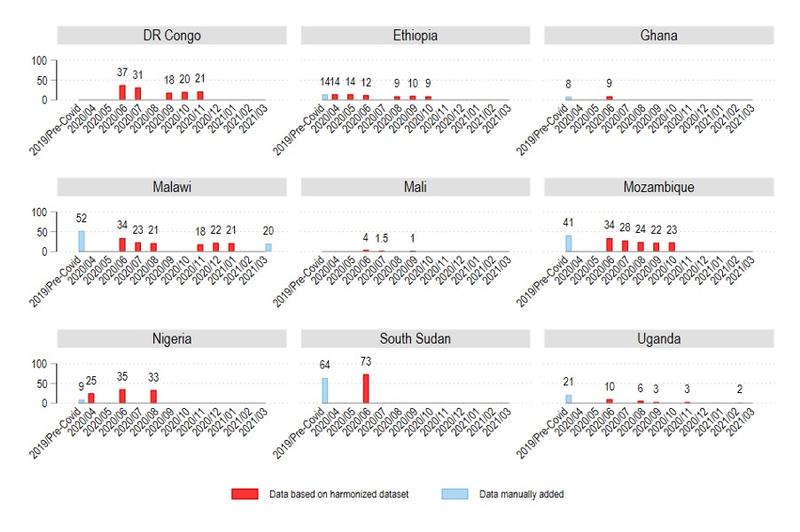
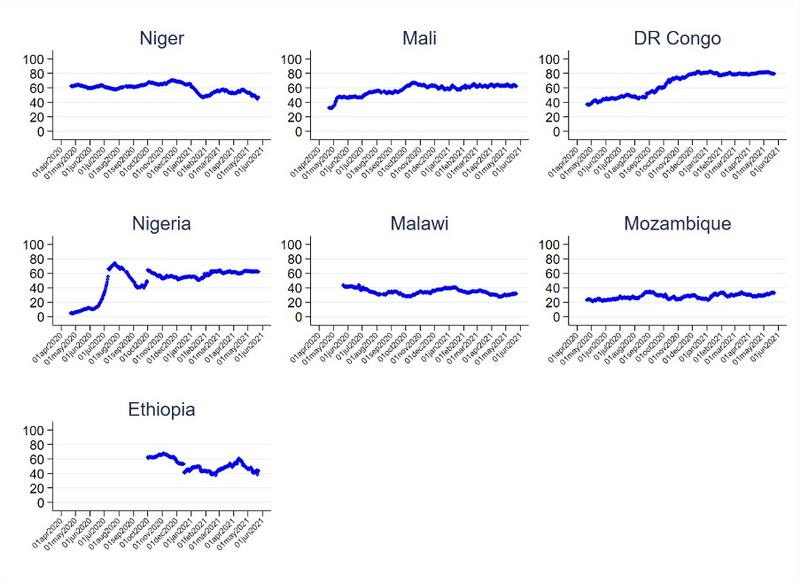
Challenges in accessing health services: We also have data on access to health services from the WFP. It is important to point out the difference in the question between the WB and WFP surveys. While the WB asked about “receiving” medical attention, the WFP asked about “challenges in accessing health services”. Respondents may actually receive medical attention despite having challenges.
WFP data shows that a large share of people report challenges accessing health services, varying between 20% and 80% across countries and over time (Figure 12). Levels are especially high in West African countries, DR Congo, and Ethiopia (40-80%), but lower in East-Central Africa (Malawi and Mozambique) with 20-40%.
Diverging patterns emerge over time. In some countries, there has been a strong increase in the share of people reporting challenges in accessing health services since the outbreak of COVID-19 (Nigeria, Mali, DR Congo). The increase has been particularly strong in DR Congo, and this is the only country where we also observe a reduction also in the share who received care (Figure 11).
In other countries, the share of people with challenges in accessing health care has been reduced (Niger, Malawi, and Ethiopia), while in Mozambique the share has remained fairly stable.
Figure 12: Percentage reporting challenges accessing health services when needed
4. Conclusions and recommendations
Our analyses show that during the COVID-19 period there was a deterioration in some key dimensions of people’s livelihoods, but in other areas change has been fairly limited. This is in line with findings presented in our previous report from late 2020.
The second wave of the pandemic seems to have had smaller effects on people’s livelihoods than the first wave, even if its health impacts were more severe.
Key findings summarized:
- A significant share of the population was temporarily out of work immediately after the COVID-19 outbreak, and many have lost income. A few months later, not only was there a recovery in most countries, but a few countries also had a higher share of the population working.
- Food insecurity is high in many countries. However, we do not observe a general increase in food insecurity in the wake of the pandemic.
- We observe frequent use of crisis-level coping strategies. While the use of such strategies has increased significantly in some countries during the pandemic, the opposite is the case in other countries.
- While social assistance programs have been implemented in several countries, the share of the population reached by such programs is much lower than those who report food insecurity.
- Children have been out of school for many months. Access to learning activities has been quite limited in this period.
- Throughout the pandemic, large proportions of the populations have received health care when needed, even though challenges in accessing the services have increased in some countries.
The data show that the socio-economic situation, for instance in terms of food insufficiency, differs markedly across countries. This was the case before COVID-19 and is still the case. These differences are probably more important indicators of the need for support than of the disruptions that have occurred because of the pandemic.
One important shortcoming of the data used in this report is that there is no information about income levels (or consumption). Such data are essential to assess the impact of the pandemic on poverty levels.
Another important shortcoming is the lack of information about how many children have returned to school after the lockdowns.
After we completed data collection for this report, many African countries have been hit by a third wave, more severe than the previous ones. We recommend investing in high-quality data collection and reviews of various data sources and studies to continue monitoring the socio-economic consequences of the pandemic.
Notes
[1] https://www.worldbank.org/en/programs/lsms/brief/lsms-launches-high-frequency-phone-surveys-on-covid-19
[2] https://hungermap.wfp.org/
[3] https://www.worldbank.org/en/data/interactive/2020/11/11/covid-19-high-frequency-monitoring-dashboard
[4] https://www.worldbank.org/en/programs/lsms/brief/lsms-launches-high-frequency-phone-surveys-on-covid-19
[5] https://microdata.worldbank.org/index.php/catalog/hfps#_r=&collection=&country=&dtype=&from=1890&page=1&ps=&sid=&sk=&sort_by=nation&sort_order=&to=2021&topic=&view=s&vk=
[6] However, especially regarding Mali, we note significant differences in observed food insecurity between the WB and WFP data. According to the WFP data, between 40% and 60% experienced moderate or severe food insecurity. In this specific case, we tend to have more confidence in the WFP data given that their expertise and focus is much more geared towards food security than the WB.
[7] We also analyzed WB data on crisis-level coping strategies (e.g., selling assets, reduced consumption), but there are too few data points to observe trends over time and countries.
[8] https://github.com/OxCGRT/covid-policy-tracker/tree/master/data


